Influence operationalizations
Last compiled on oktober, 2022
We will show how the influence statistics in RSiena behave. We assume that ego is connected to all alters.
Functions
First, we define some functions:
Centering behavior variables
fcentering <- function(actors) {
    centered <- actors - mean(actors)
    return(centered)
}
Calculating similarity scores
\[ sim^z_{ij} = 1 - \frac{|z_i - z_j|}{r_V} \]
fsimij <- function(actors, min, max) {
    # rv <- max(actors) - min(actors)
    rv <- max - min
    mat1 <- matrix(actors, nrow = length(actors), ncol = length(actors), byrow = TRUE)
    mat2 <- t(mat1)
    simij <- 1 - (abs(mat1 - mat2)/rv)
    return(simij)
}
linear shape
flinear <- function(ego, alters, ...) {
    actors <- c(ego, alters)  #define the network
    beh_centered <- fcentring(actors)  #center behavior scores

    statistic <- beh_centered[1]  #the actual statistic

    return(statistic)
}
quadratic shape
fquad <- function(ego, alters, ...) {
    actors <- c(ego, alters)  #define the network
    beh_centered <- fcentring(actors)  #center behavior scores

    statistic <- (beh_centered[1])^2  #the actual statistic

    return(statistic)
}
The average similarity effect (avSim)
\[ s^{beh}_{i5}(x,z) = x^{-1}_{i+}\sum_j x_{ij}(sim^z_{ij} - \widehat{sim^z}) \]
favSim <- function(ego, alters, min, max) {
    actors <- c(ego, alters)  #define the network
    beh_centered <- fcentering(actors)  #center behavior scores
    simij <- fsimij(beh_centered, min, max)  #calculate the similarity scores
    diag(simij) <- NA
    msimij <- mean(simij, na.rm = TRUE)  #calculate the mean similarity score. only calculate mean on non-diagonal cells??!!
    simij_c <- simij - msimij  #center the similarity scores

    statistic <- sum(simij_c[1, ], na.rm = TRUE)/length(alters)  #the actual statistic

    return(statistic)
}
favSim2 <- function(ego, alters, min, max) {
actors <- c(ego, alters) #define the network
beh_centered <- fcentring(actors) #center behavior scores
simij <- fsimij(beh_centered, min, max) #calculate the similarity scores
diag(simij) <- NA
# msimij <- mean(simij, na.rm=TRUE) #calculate the mean similarity score. only calculate mean
# on non-diagonal cells??!!
simij_c <- simij # - msimij #center the similarity scores
statistic <- sum(simij_c[1, ], na.rm = TRUE)/length(alters) #the actual statistic
return(statistic)
}The average attraction towards higher effect (avAttHigher)
\[ s^{beh}_{i23}(x,z) = x^{-1}_{i+}\sum_j x_{ij} (\, I \{ (z_j)>z_i \} sim^z_{ij} + I \{ (z_j ) \le z_i \} )\,\]
favAttHigher <- function(ego, alters, min, max) {
    actors <- c(ego, alters)
    beh_centered <- fcentering(actors)
    simij <- fsimij(beh_centered, min, max)
    diag(simij) <- NA

    simijH <- simij[1, ]
    simijH[beh_centered <= beh_centered[1]] <- 1
    simijH[1] <- NA
    statistic <- sum(simijH, na.rm = TRUE)/length(alters)

    return(statistic)
}
The average attraction towards higher alters effect (avAttLower)
\[ s^{beh}_{i24}(x,z) = x^{-1}_{i+}\sum_j x_{ij} (\, I \{ (z_j)<z_i \} sim^z_{ij} + I \{ (z_j ) \ge z_i \} )\,\]
favAttLower <- function(ego, alters, min, max) {
    actors <- c(ego, alters)
    beh_centered <- fcentering(actors)
    simij <- fsimij(beh_centered, min, max)
    diag(simij) <- NA

    simijL <- simij[1, ]
    simijL[beh_centered >= beh_centered[1]] <- 1
    simijL[1] <- NA
    statistic <- sum(simijL, na.rm = TRUE)/length(alters)

    return(statistic)
}
Average alter effect (avAlt)
\[ s^{beh}_{i27}(x,z) = z_i(\textstyle \sum_jx_{ij}z_j)/(\textstyle \sum_jx_{ij}) \]
favAlt <- function(ego, alters, ...) {
    actors <- c(ego, alters)
    beh_centered <- fcentering(actors)

    statistic <- beh_centered[1] * (sum(beh_centered[-1], na.rm = TRUE)/length(alters))

    return(statistic)
}
Average attraction mean (AttMean)
We are attracted to the mean of our alters!
(behaves approximately similar to avAlt, different shape.)
\[ s^{beh}_{i}(x,z) = 1 - \frac{\lvert(z_i - x^{-1}_{i+}\sum_j x_{ij}z_j)\rvert}{r_Z} \]
fAttMean <- function(ego, alters, min, max, ...) {
    rv <- max - min
    actors <- c(ego, alters)
    beh_centered <- fcentring(actors)

    statistic <- 1 - abs(beh_centered[1] - (sum(beh_centered[-1], na.rm = TRUE)/length(alters)))/rv  #thus we strive for a highest local similarity score!

    return(statistic)
}
Make plot of statistic values
finluenceplot <- function(alters, min, max, fun, params, results = TRUE, plot = TRUE) {
    # check correct number of parameters are given
    if (length(fun) != length(params))
        stop("Please provide one (and only one) parameter for each of the behavioral effects!")

    # calculuate value of evaluation function
    s <- NA
    for (i in min:max) {
        s[i] <- 0
        for (j in 1:length(fun)) {
            s[i] <- s[i] + params[j] * fun[[j]](i, alters, min, max)
        }
    }

    # calculate the probabilities
    p <- NA
    for (i in min:max) {
        p[i] <- exp(s[i])/sum(exp(s))
    }

    # calculate the probabilities of choice set
    p2 <- NA
    for (i in min:max) {
        if (i == min) {
            p2[i] <- exp(s[i])/sum(exp(s[i]) + exp(s[i + 1]))
        } else if (i == max) {
            p2[i] <- exp(s[i])/sum(exp(s[i]) + exp(s[i - 1]))
        } else {
            p2[i] <- exp(s[i])/sum(exp(s[i]) + exp(s[i - 1]) + exp(s[i + 1]))
        }
    }

    # calculate the probability ratio
    r <- NA
    for (i in min:max) {
        r[i] <- p[i]/p[1]
    }

    # some simple plots
    if (plot) {
        name <- deparse(substitute(fun))
        name <- stringr::str_sub(as.character(name), 6, -2)
        par(mfrow = c(2, 2))
        plot(y = s, x = min:max, xlab = "ego behavioral score", ylab = name, type = "b")
        mtext("EVALUATION", line = 1)
        mtext(paste("alters:", paste0(alters, collapse = ",")))
        plot(y = p, x = min:max, xlab = "ego behavioral score", ylab = name, ylim = c(0, 1), type = "b")
        mtext("PROBABILITIES", line = 1)
        mtext(paste("alters:", paste0(alters, collapse = ",")))
        plot(y = p2, x = min:max, xlab = "ego behavioral score", ylab = name, ylim = c(0, 1), type = "b")
        mtext("PROBABILITIES_choice_set", line = 1)
        mtext(paste("alters:", paste0(alters, collapse = ",")))
        plot(y = r, x = min:max, xlab = "ego behavioral score", ylab = name, type = "b")
        mtext("RATIOS", line = 1)
        mtext(paste("alters:", paste0(alters, collapse = ",")))
    }

    # return results for more fancy plotting
    if (results) {
        x <- min:max
        df <- data.frame(x, s, p, p2, r)
        return(df)
    }

}
Examples
alters1 <- rep(c(3, 3, 3, 3, 3, 3), 1)

finluenceplot(alters = alters1, min = 1, max = 6, list(flinear, fquad), params = c(0.1, -1))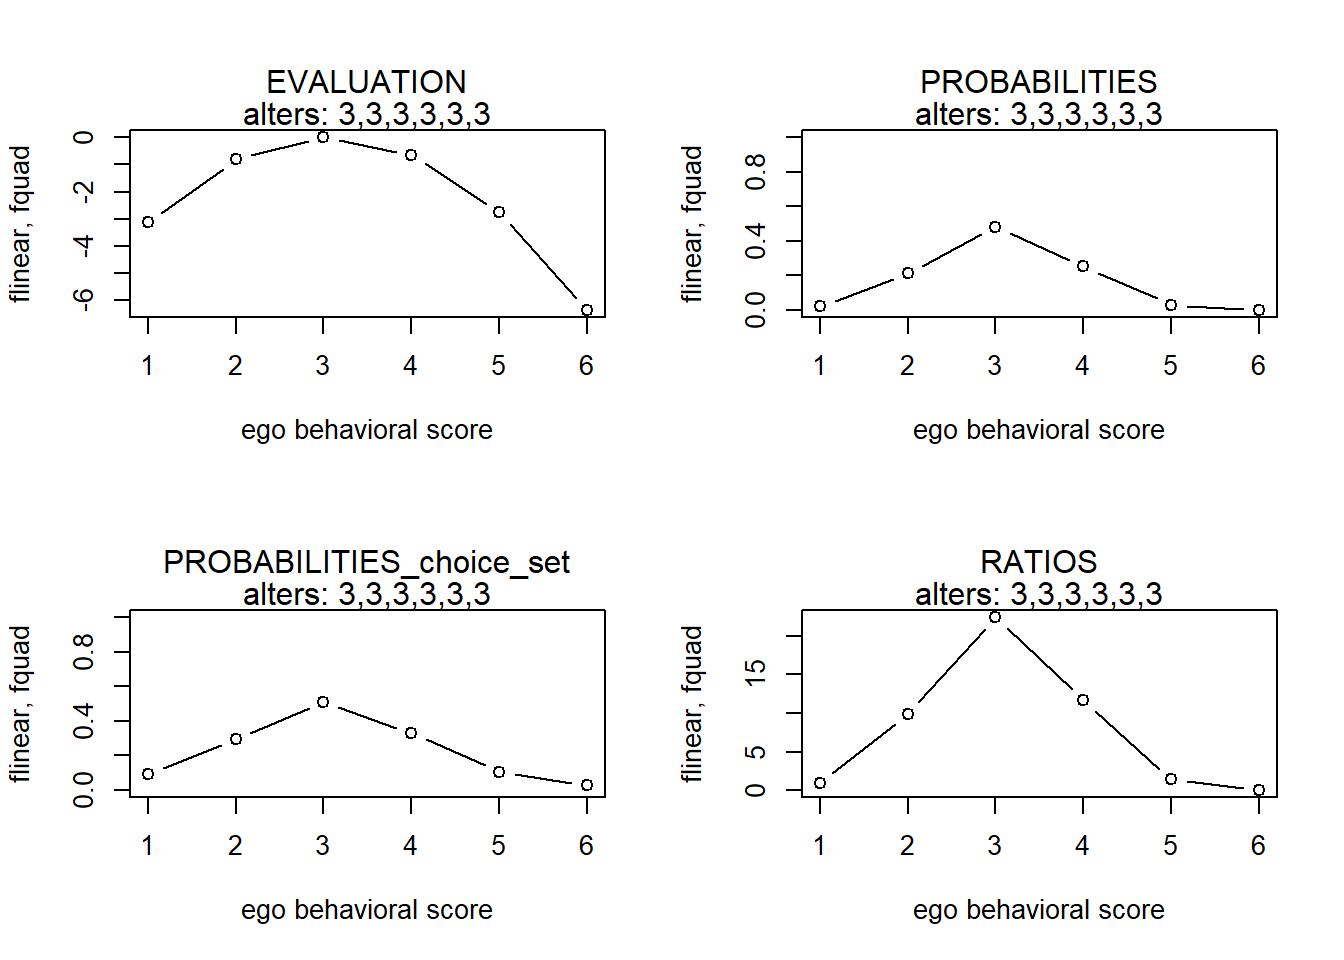
finluenceplot(alters = alters1, min = 1, max = 6, list(favSim), params = c(1))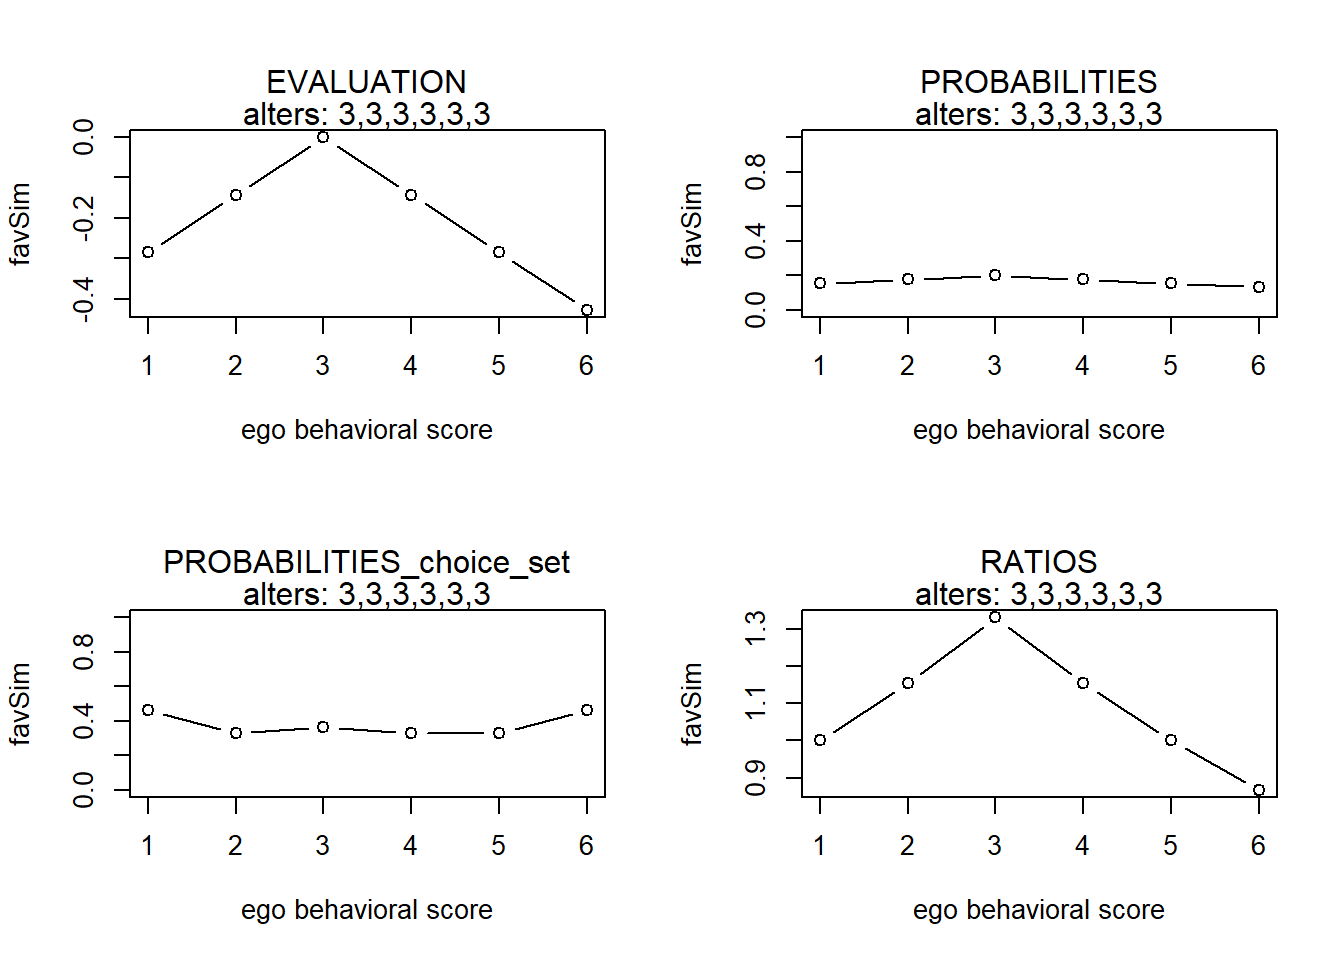
finluenceplot(alters = alters1, min = 1, max = 6, list(favAlt), params = c(1))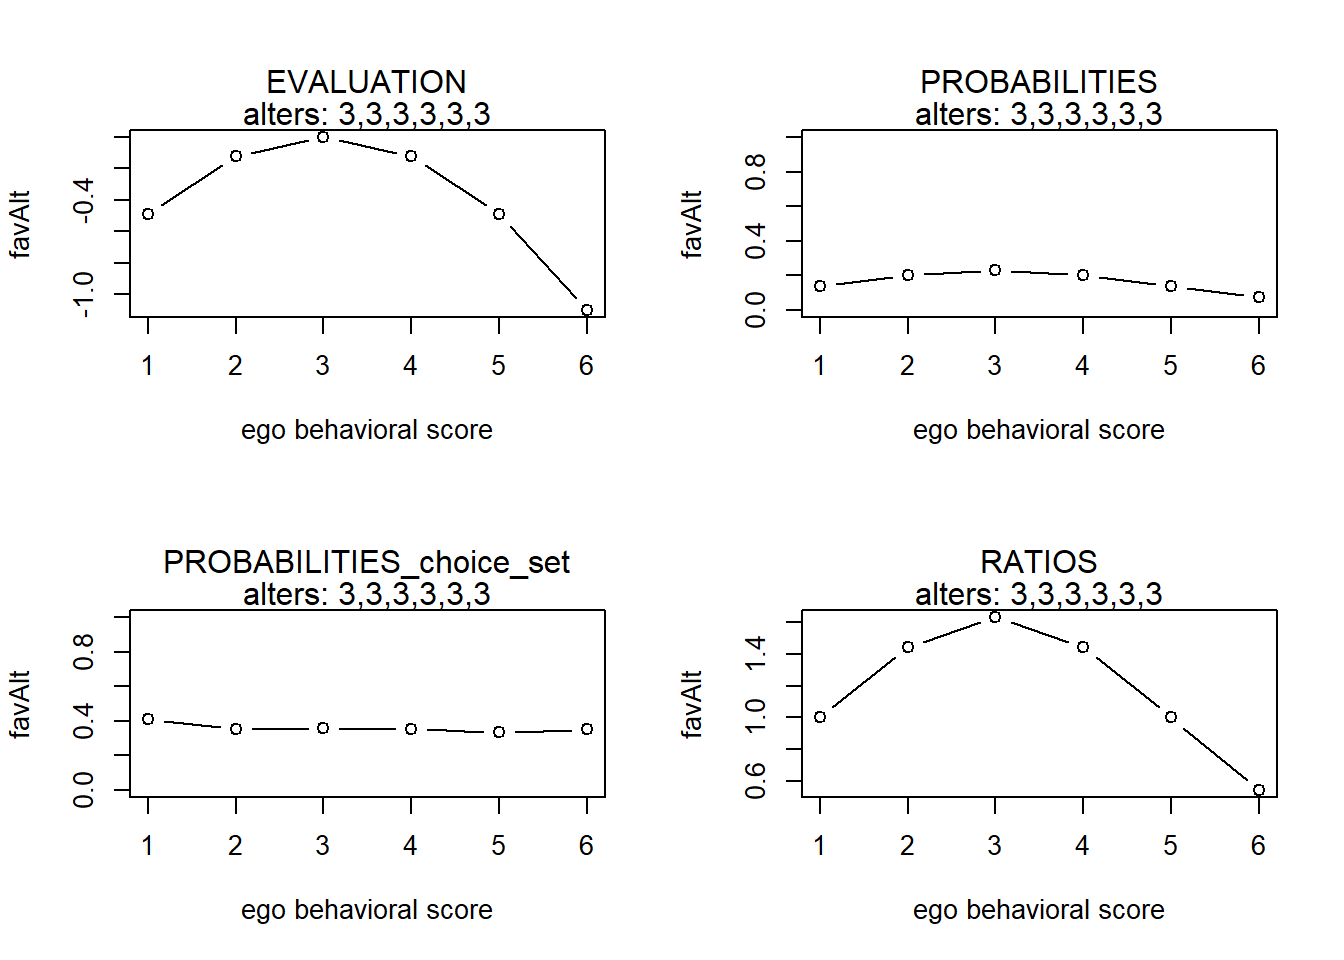
finluenceplot(alters = alters1, min = 1, max = 6, list(fAttMean), params = c(1))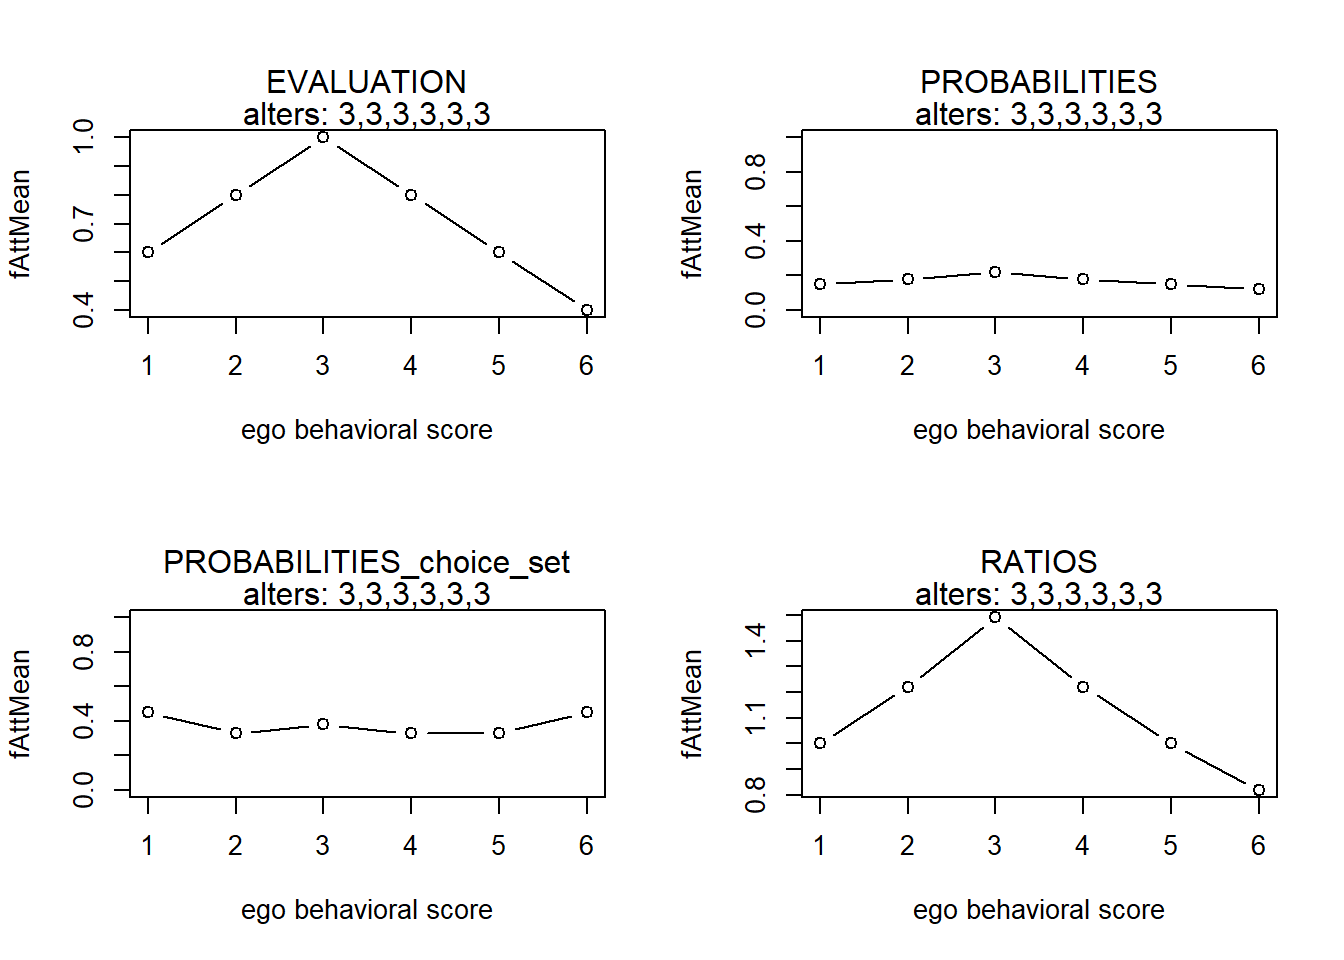
finluenceplot(alters = alters1, min = 1, max = 6, list(favAttHigher), params = c(1))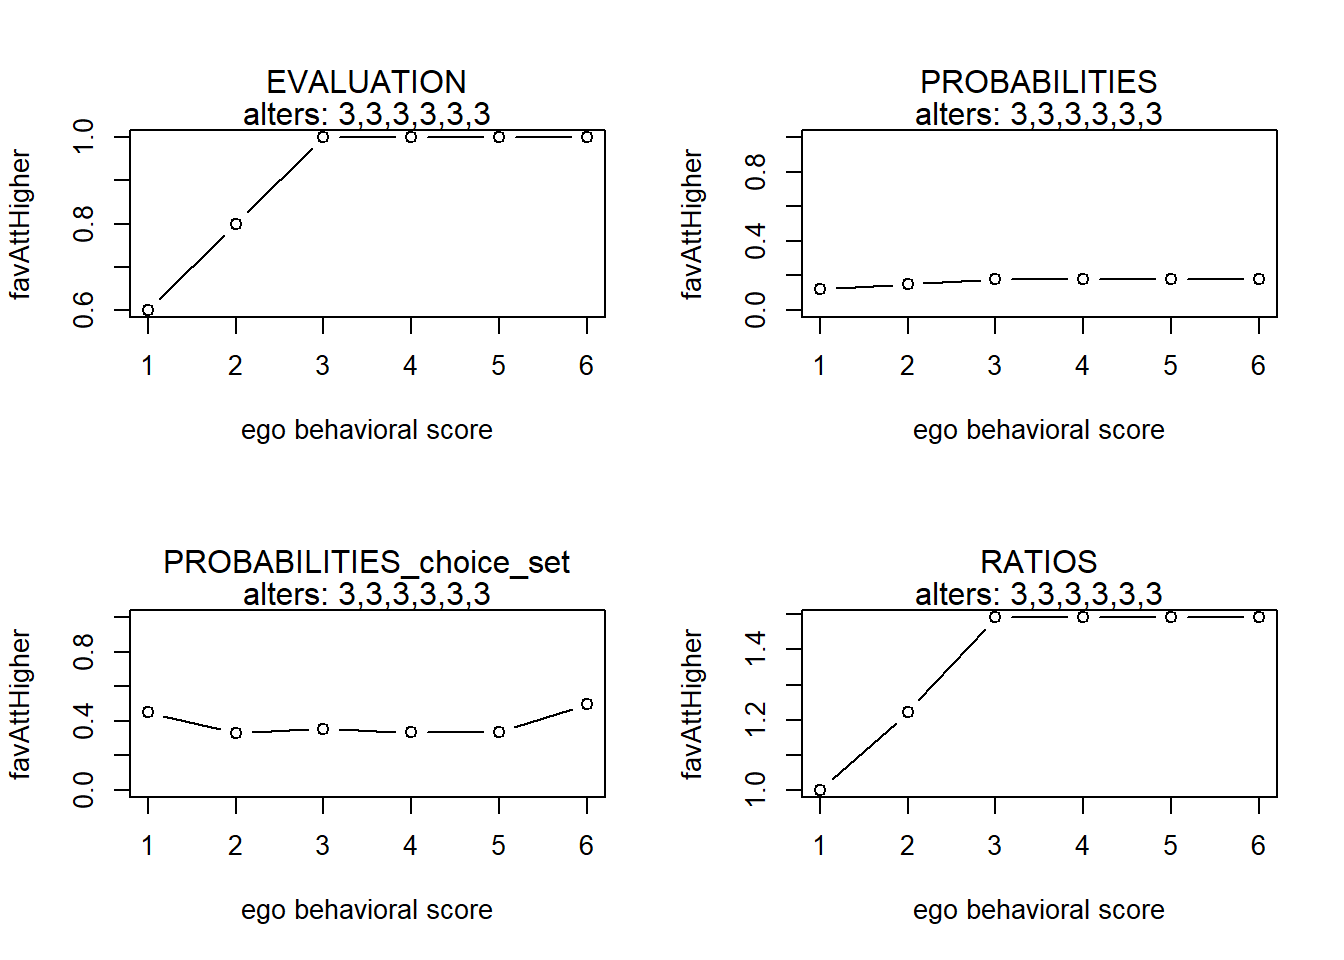
finluenceplot(alters = alters1, min = 1, max = 6, list(favAttLower), params = c(1))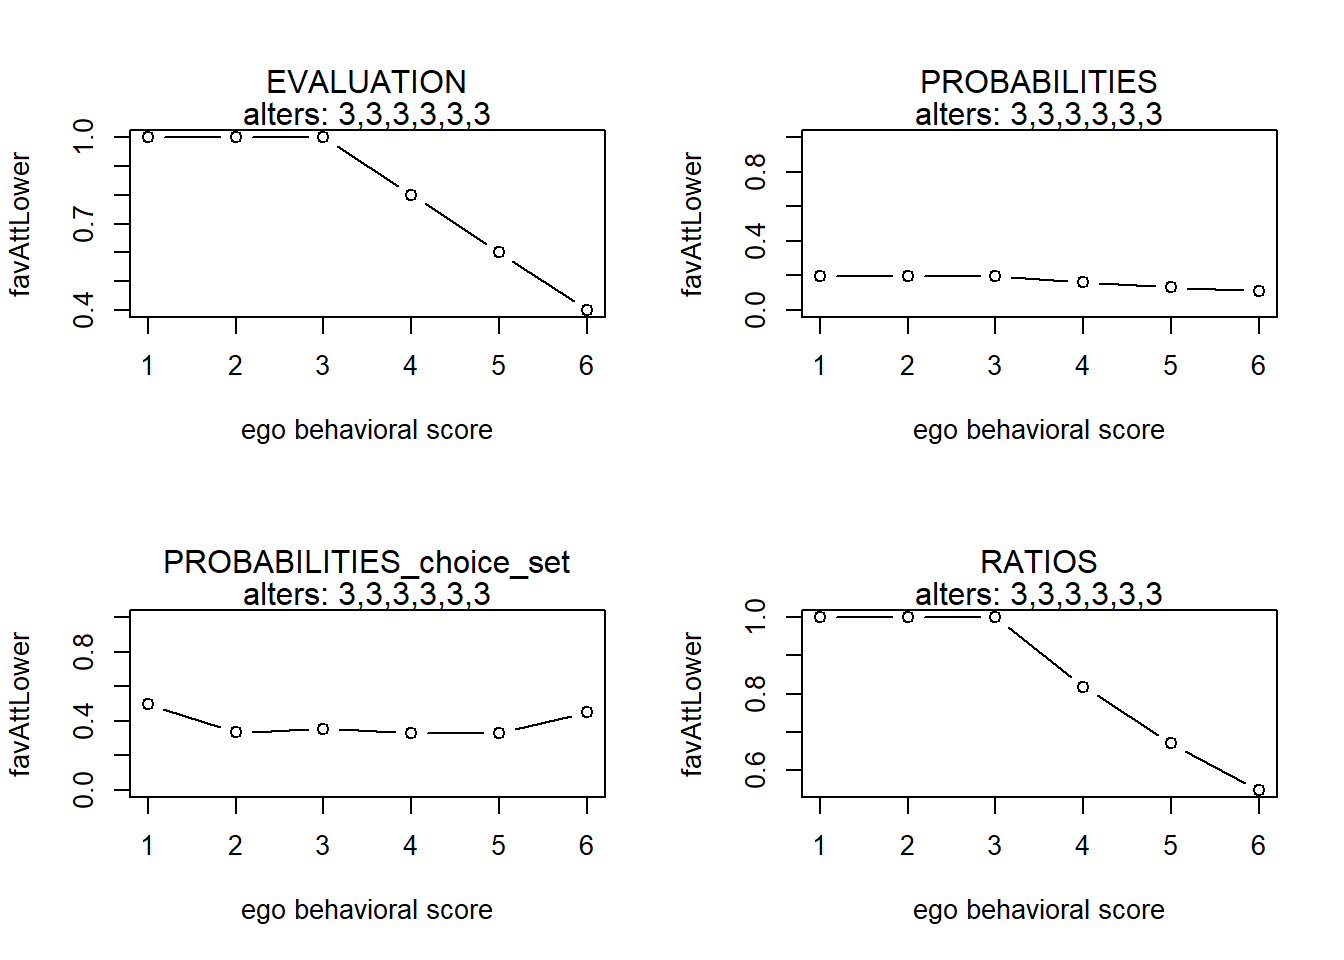
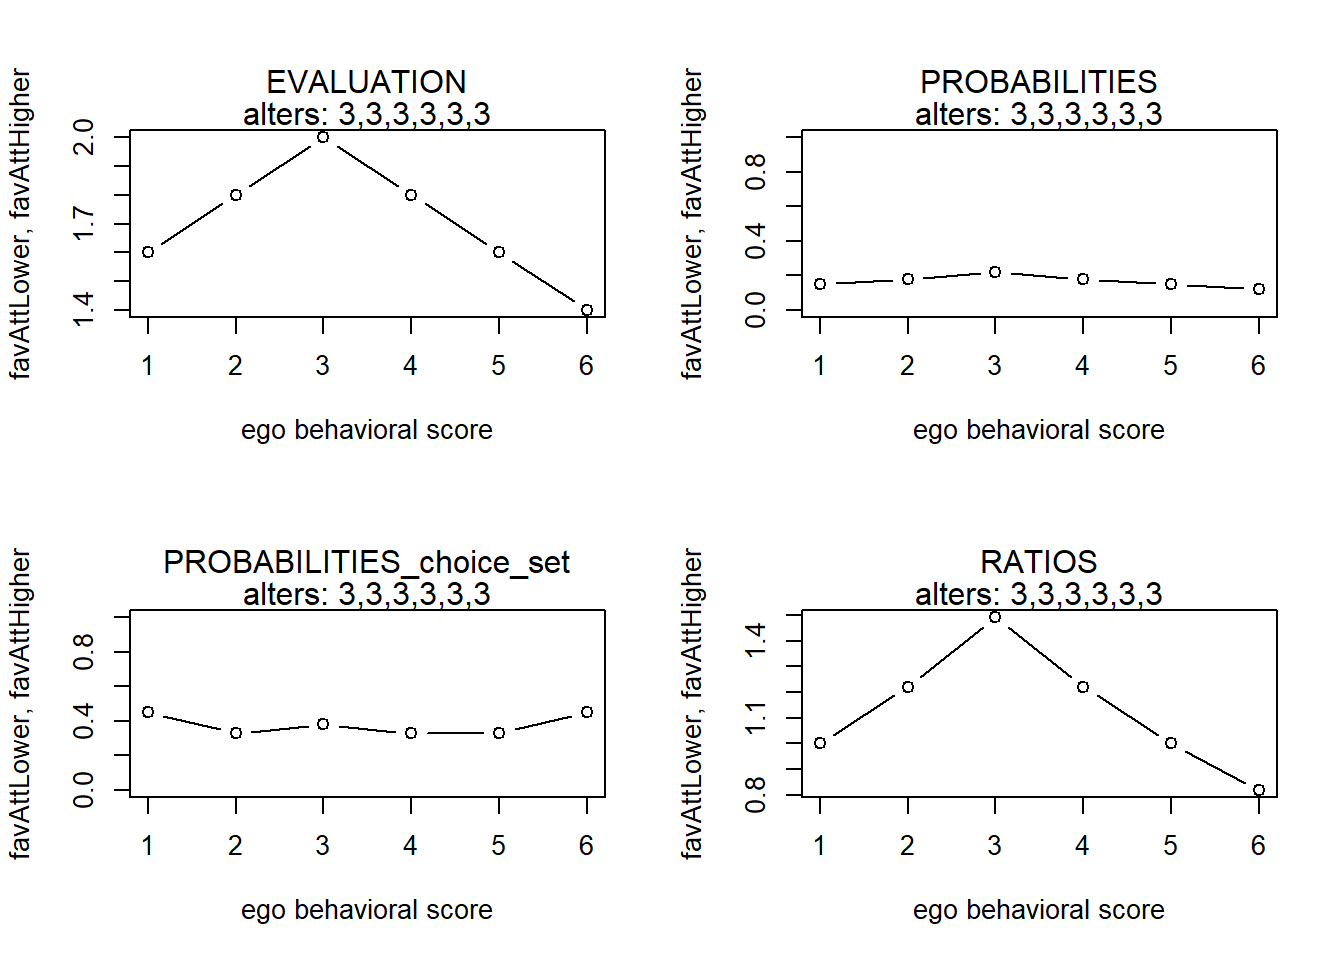
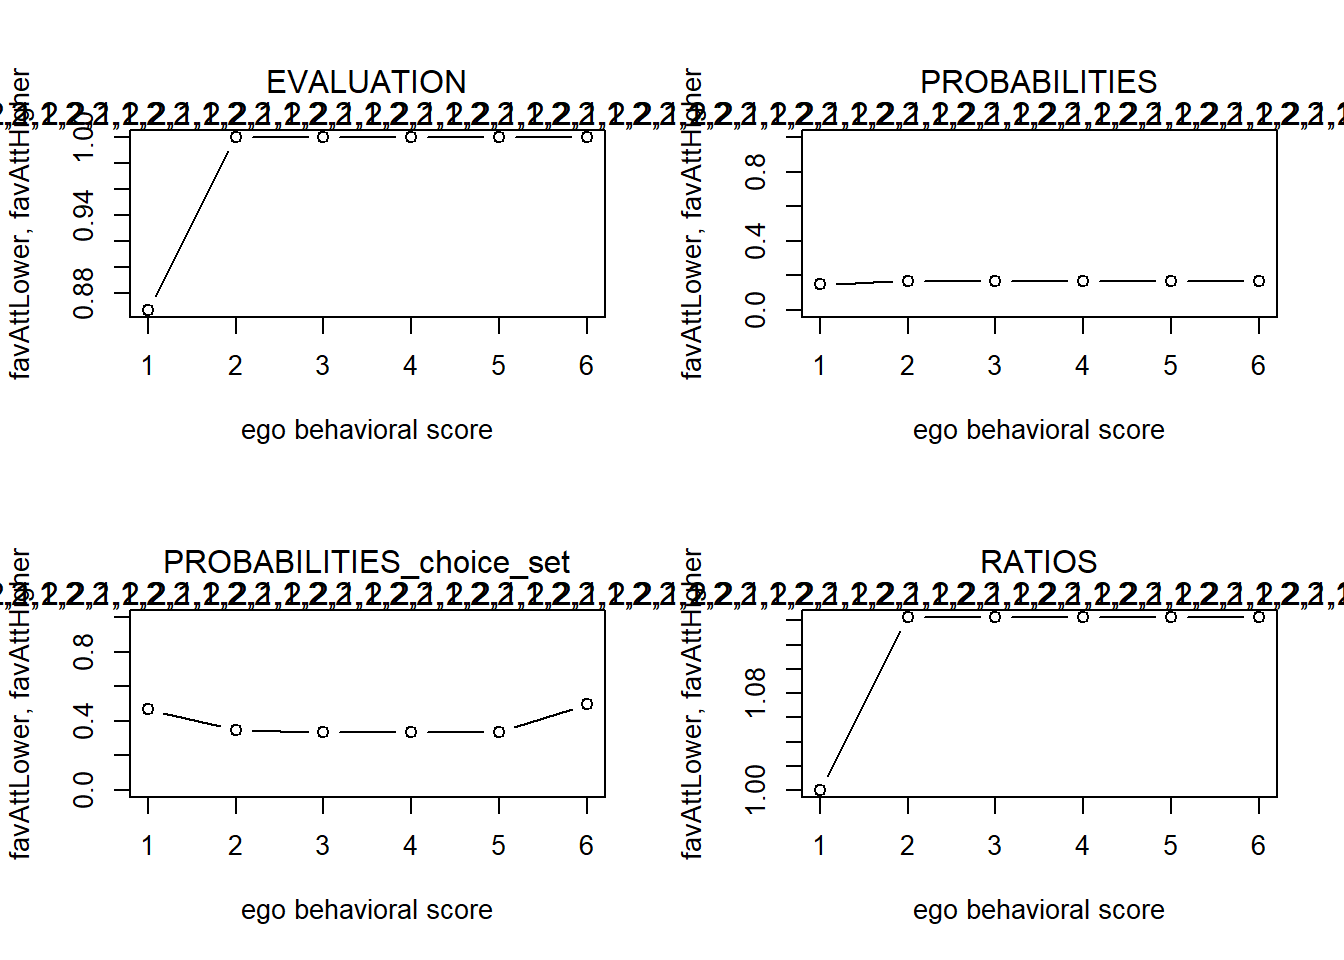
finluenceplot(alters = alters1, min = 1, max = 6, fun = list(favAttLower, favAttHigher), params = c(1,
    1))
finluenceplot(alters = alters1, min = 1, max = 6, list(fAttMean, favAttHigher), params = c(1, 1))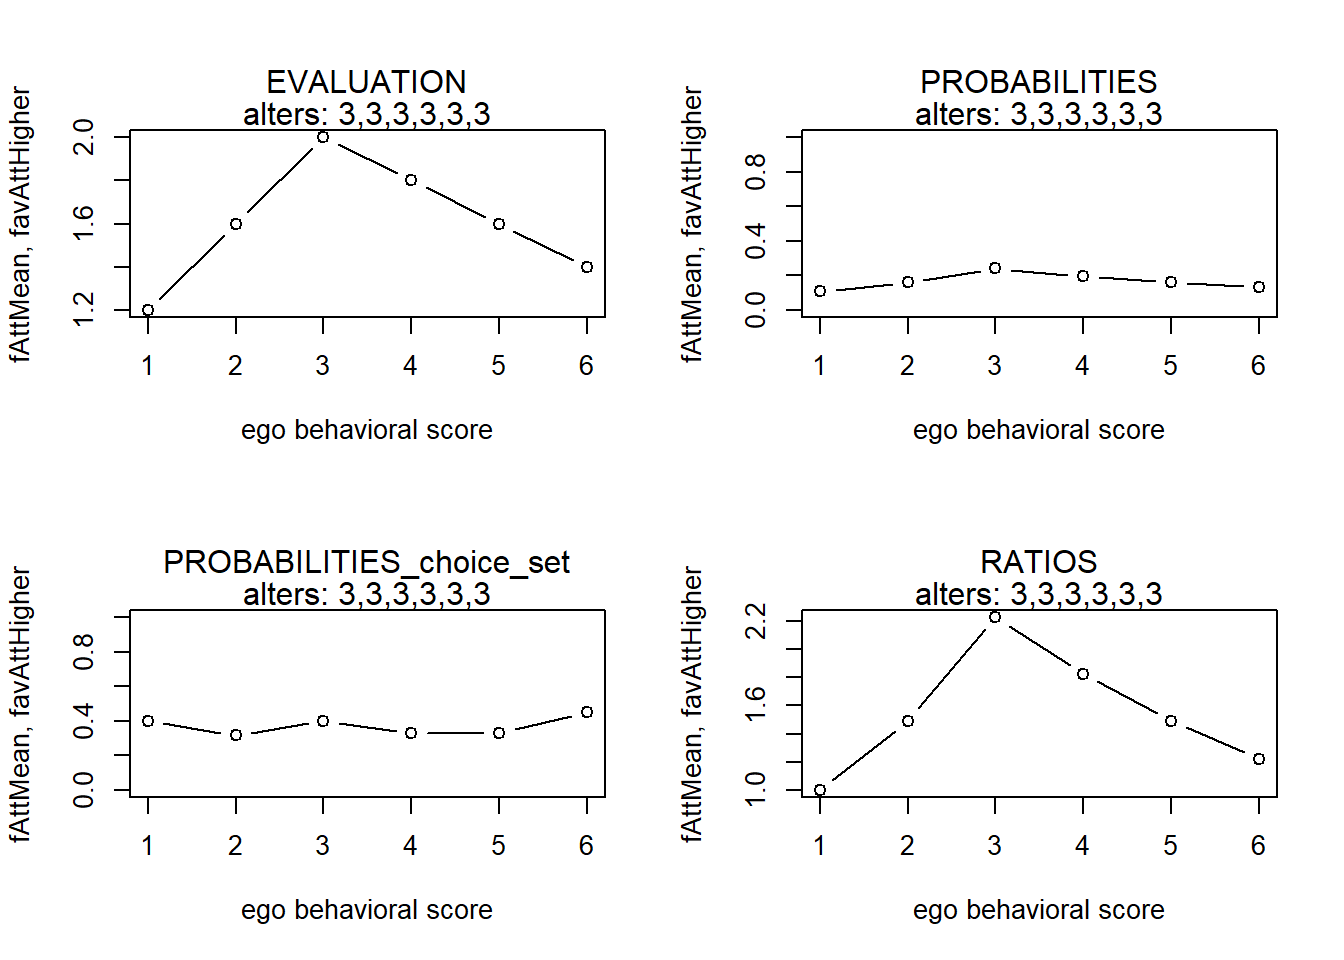
#> x s p p2 r
#> 1 1 -3.1102041 0.021521281 0.09197159 1.00000000
#> 2 2 -0.8204082 0.212477940 0.29649713 9.87292259
#> 3 3 0.0000000 0.482628079 0.50946830 22.42562059
#> 4 4 -0.6489796 0.252211177 0.32961799 11.71915274
#> 5 5 -2.7673469 0.030322785 0.10700672 1.40896747
#> 6 6 -6.3551020 0.000838739 0.02691585 0.03897254
#> x s p p2 r
#> 1 1 -0.2857143 0.1537345 0.4643463 1.0000000
#> 2 2 -0.1428571 0.1773428 0.3310773 1.1535650
#> 3 3 0.0000000 0.2045764 0.3657971 1.3307122
#> 4 4 -0.1428571 0.1773428 0.3310773 1.1535650
#> 5 5 -0.2857143 0.1537345 0.3310773 1.0000000
#> 6 6 -0.4285714 0.1332691 0.4643463 0.8668779
#> x s p p2 r
#> 1 1 -0.4897959 0.1416047 0.4091822 1.0000000
#> 2 2 -0.1224490 0.2044628 0.3542543 1.4438988
#> 3 3 0.0000000 0.2310965 0.3610757 1.6319831
#> 4 4 -0.1224490 0.2044628 0.3542543 1.4438988
#> 5 5 -0.4897959 0.1416047 0.3348927 1.0000000
#> 6 6 -1.1020408 0.0767685 0.3515473 0.5421325
#> x s p p2 r
#> 1 1 0.6 0.1480744 0.4501660 1.0000000
#> 2 2 0.8 0.1808585 0.3289329 1.2214028
#> 3 3 1.0 0.2209011 0.3791525 1.4918247
#> 4 4 0.8 0.1808585 0.3289329 1.2214028
#> 5 5 0.6 0.1480744 0.3289329 1.0000000
#> 6 6 0.4 0.1212331 0.4501660 0.8187308
#> x s p p2 r
#> 1 1 0.6 0.1221195 0.4501660 1.000000
#> 2 2 0.8 0.1491571 0.3289329 1.221403
#> 3 3 1.0 0.1821809 0.3547696 1.491825
#> 4 4 1.0 0.1821809 0.3333333 1.491825
#> 5 5 1.0 0.1821809 0.3333333 1.491825
#> 6 6 1.0 0.1821809 0.5000000 1.491825
#> x s p p2 r
#> 1 1 1.0 0.1984969 0.5000000 1.0000000
#> 2 2 1.0 0.1984969 0.3333333 1.0000000
#> 3 3 1.0 0.1984969 0.3547696 1.0000000
#> 4 4 0.8 0.1625155 0.3289329 0.8187308
#> 5 5 0.6 0.1330564 0.3289329 0.6703200
#> 6 6 0.4 0.1089374 0.4501660 0.5488116
#> x s p p2 r
#> 1 1 1.6 0.1480744 0.4501660 1.0000000
#> 2 2 1.8 0.1808585 0.3289329 1.2214028
#> 3 3 2.0 0.2209011 0.3791525 1.4918247
#> 4 4 1.8 0.1808585 0.3289329 1.2214028
#> 5 5 1.6 0.1480744 0.3289329 1.0000000
#> 6 6 1.4 0.1212331 0.4501660 0.8187308
#> x s p p2 r
#> 1 1 1.2 0.1080764 0.4013123 1.000000
#> 2 2 1.6 0.1612311 0.3162411 1.491825
#> 3 3 2.0 0.2405285 0.4017596 2.225541
#> 4 4 1.8 0.1969281 0.3289329 1.822119
#> 5 5 1.6 0.1612311 0.3289329 1.491825
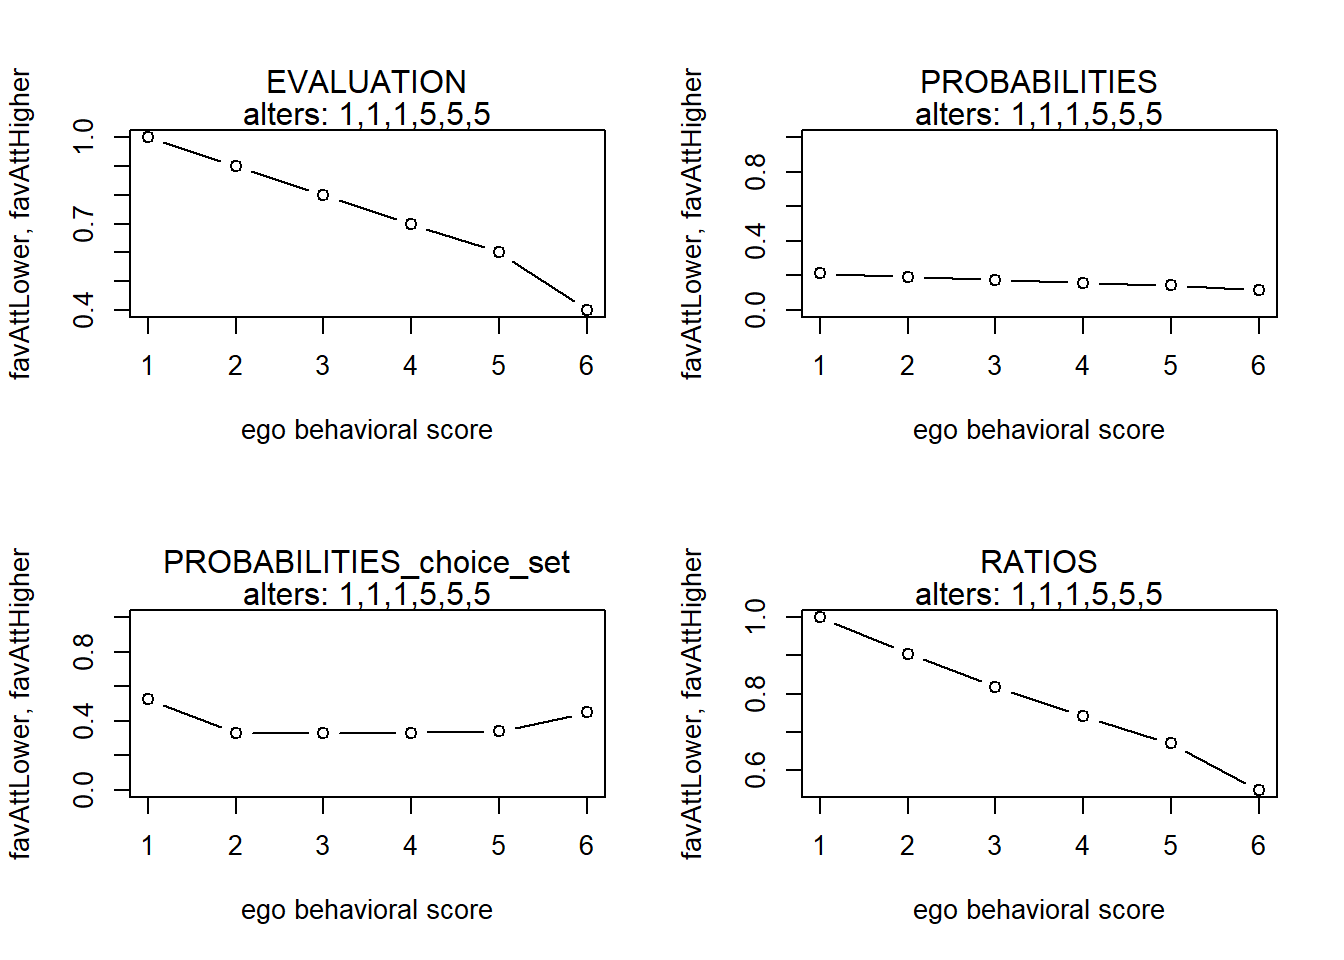
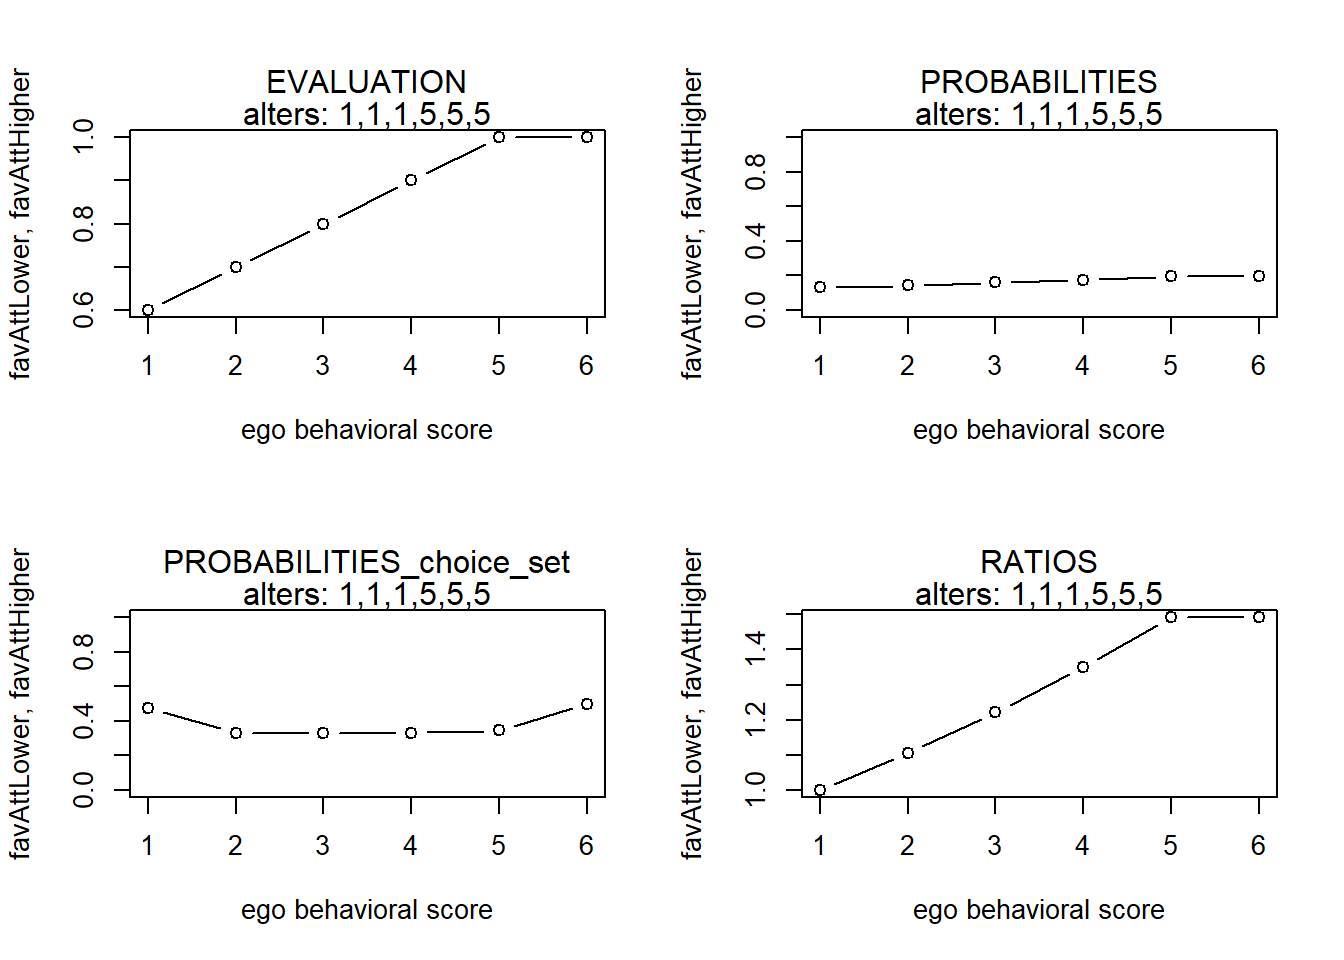
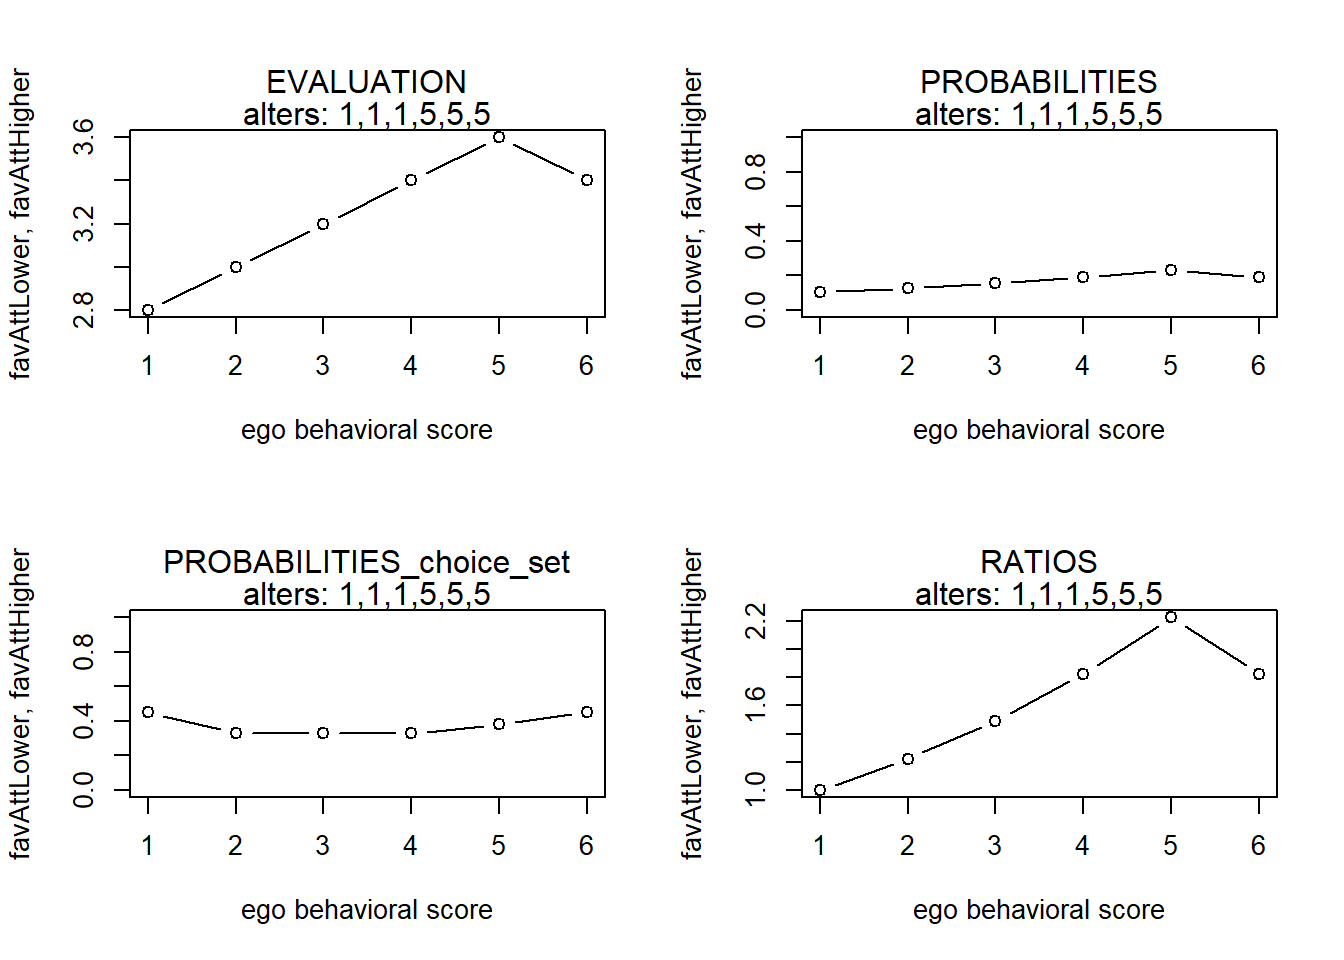
#> 6 6 1.4 0.1320048 0.4501660 1.221403alters1 <- rep(c(1, 1, 1, 5, 5, 5), 1)
finluenceplot(alters = alters1, min = 1, max = 6, list(favSim), params = c(1))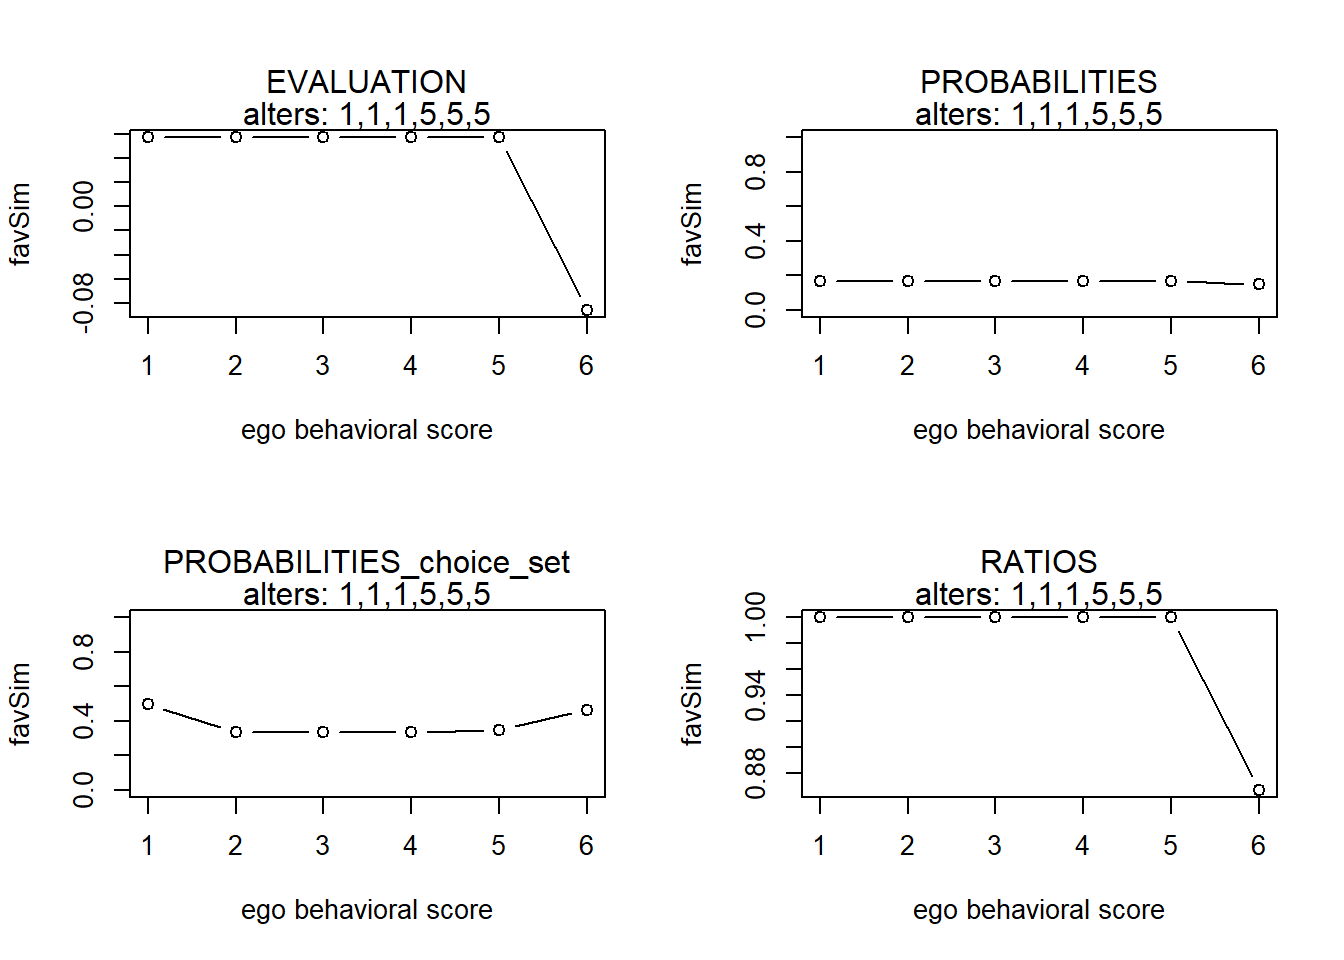
finluenceplot(alters = alters1, min = 1, max = 6, list(favAlt), params = c(1))
finluenceplot(alters = alters1, min = 1, max = 6, list(fAttMean), params = c(1))
finluenceplot(alters = alters1, min = 1, max = 6, fun = list(favAttLower, favAttHigher), params = c(1,
    0))
finluenceplot(alters = alters1, min = 1, max = 6, fun = list(favAttLower, favAttHigher), params = c(0,
    1))
finluenceplot(alters = alters1, min = 1, max = 6, fun = list(favAttLower, favAttHigher), params = c(1,
    3))
finluenceplot(alters = alters1, min = 1, max = 6, fun = list(favAttLower, favAttHigher), params = c(1,
    -1))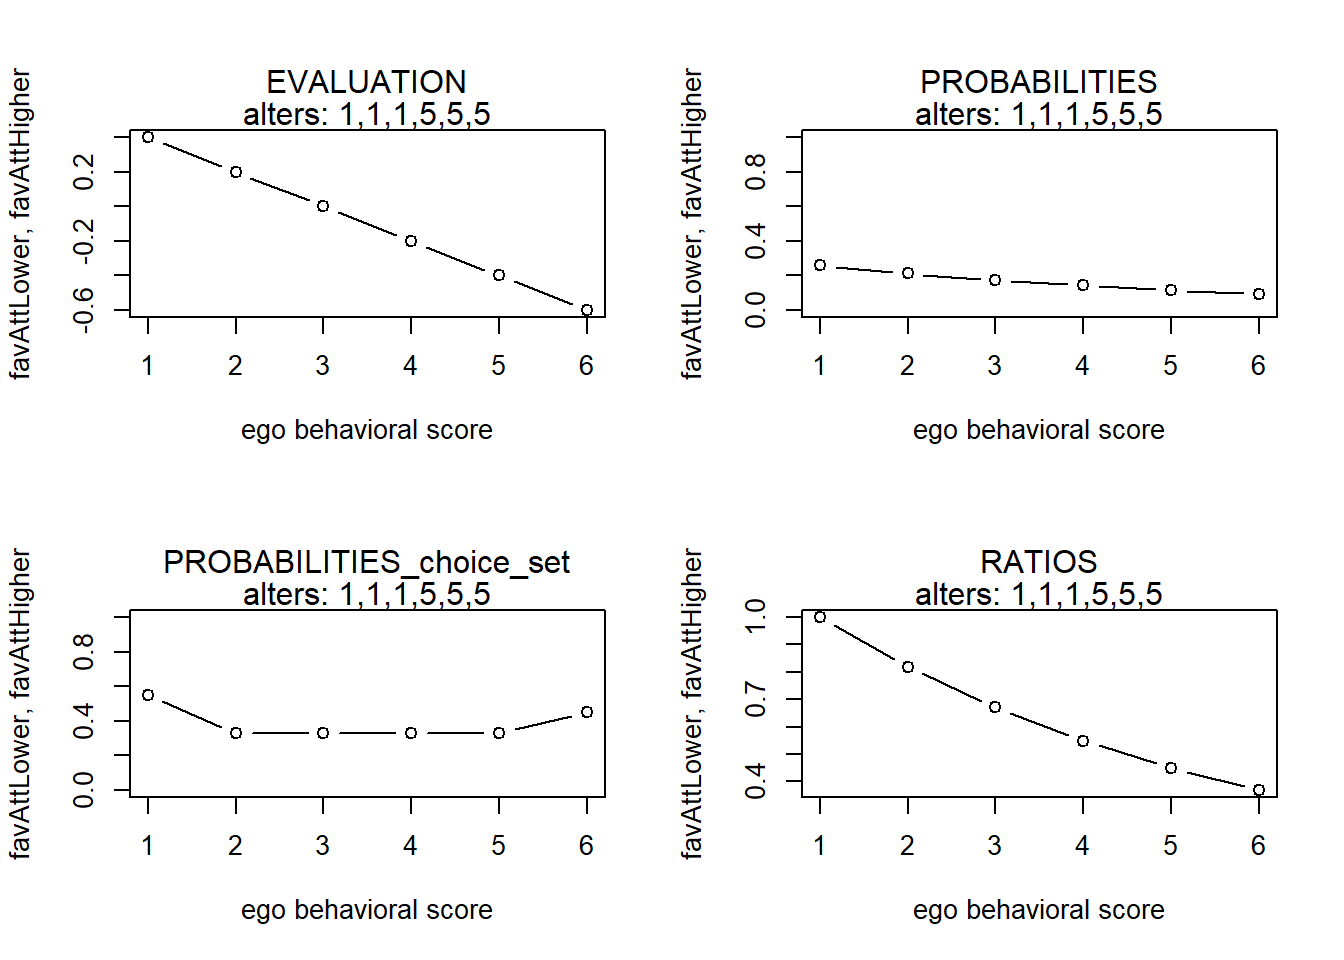
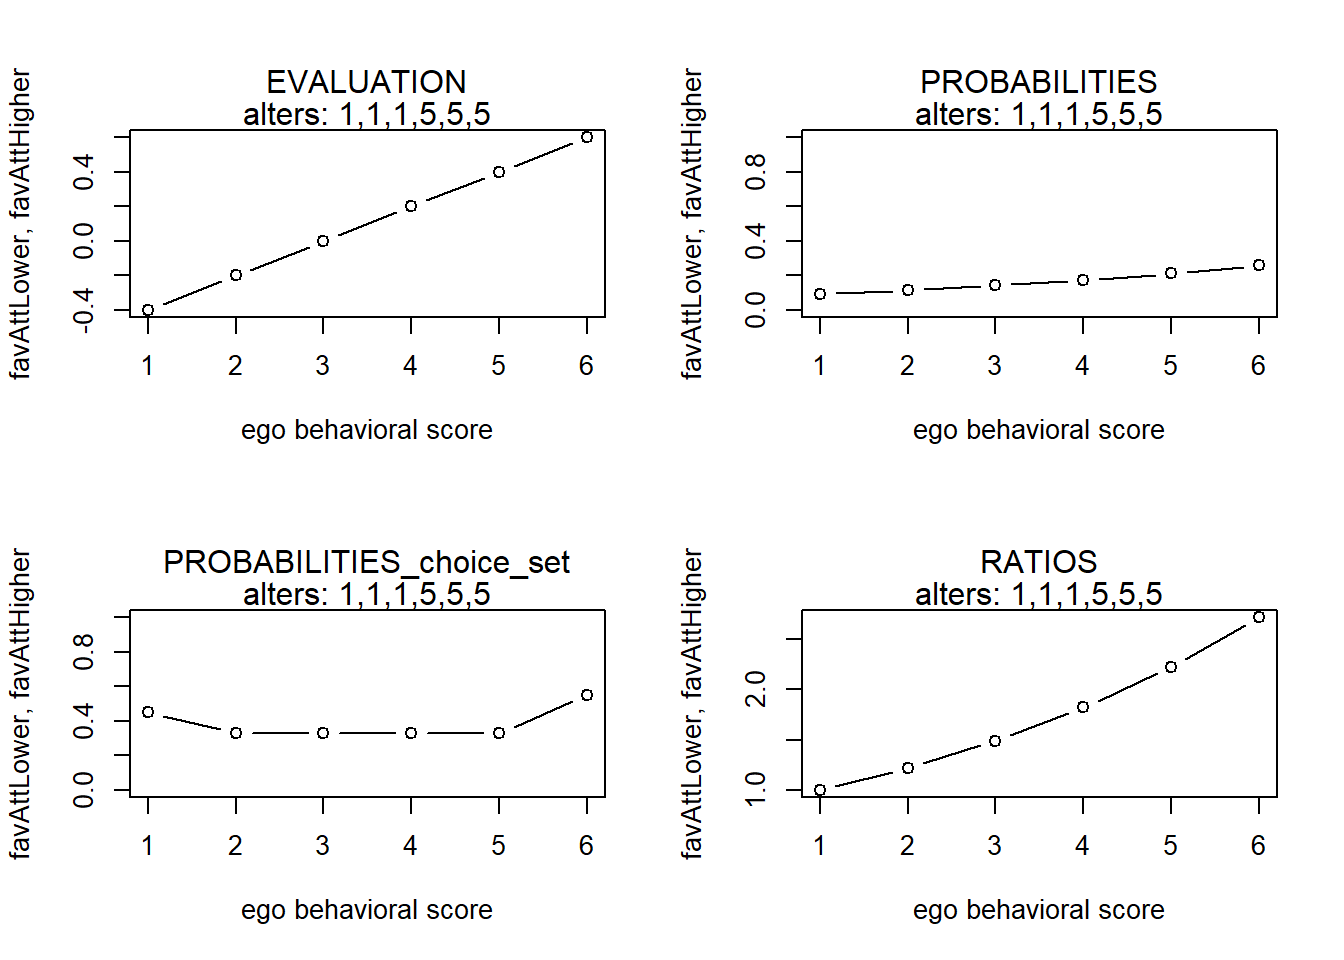
finluenceplot(alters = alters1, min = 1, max = 6, fun = list(favAttLower, favAttHigher), params = c(-1,
    1))
finluenceplot(alters = alters1, min = 1, max = 6, fun = list(flinear, favAttLower, favAttHigher), params = c(1,
    -1, 1))
finluenceplot(alters = alters1, min = 1, max = 6, fun = list(flinear, favAttLower, favAttHigher), params = c(1,
    -1, 1))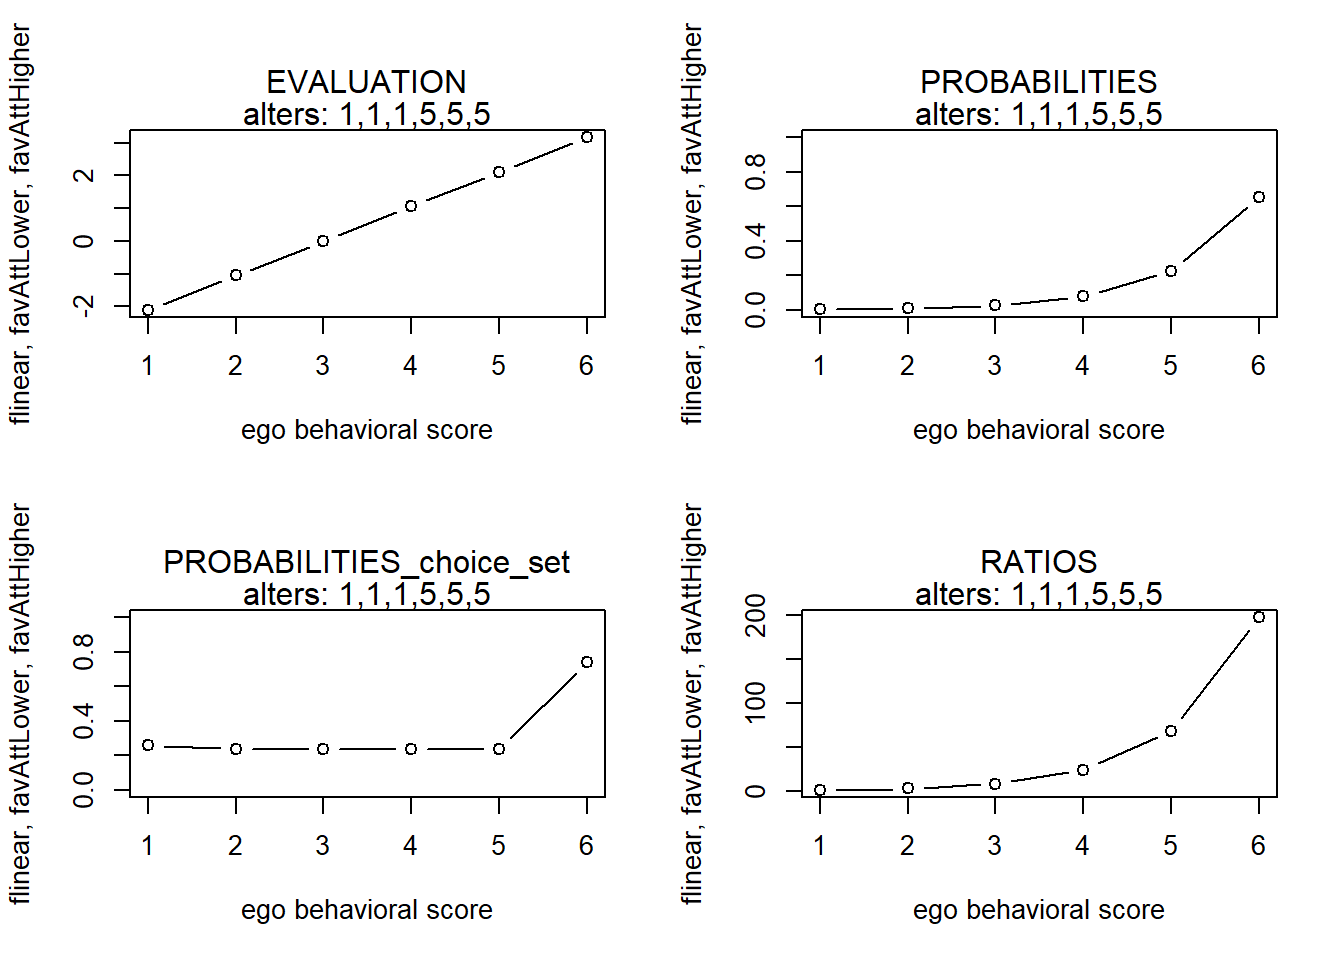
finluenceplot(alters = alters1, min = 1, max = 6, fun = list(flinear), params = c(1))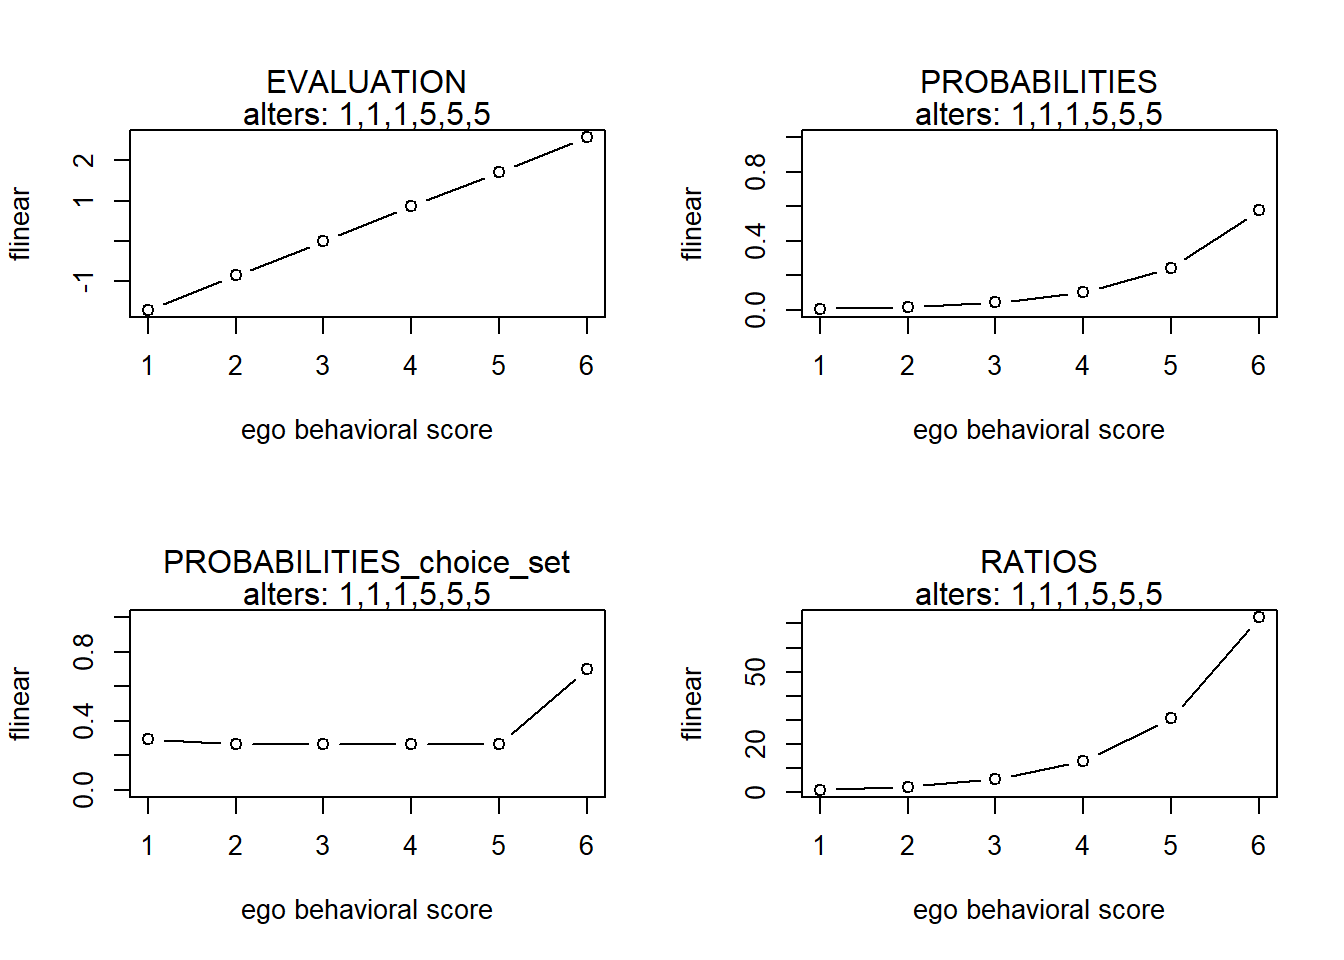
#>   x           s         p        p2         r
#> 1 1  0.05714286 0.1704484 0.5000000 1.0000000
#> 2 2  0.05714286 0.1704484 0.3333333 1.0000000
#> 3 3  0.05714286 0.1704484 0.3333333 1.0000000
#> 4 4  0.05714286 0.1704484 0.3333333 1.0000000
#> 5 5  0.05714286 0.1704484 0.3488115 1.0000000
#> 6 6 -0.08571429 0.1477580 0.4643463 0.8668779
#>   x          s         p        p2         r
#> 1 1 -0.4897959 0.1416047 0.4091822 1.0000000
#> 2 2 -0.1224490 0.2044628 0.3542543 1.4438988
#> 3 3  0.0000000 0.2310965 0.3610757 1.6319831
#> 4 4 -0.1224490 0.2044628 0.3542543 1.4438988
#> 5 5 -0.4897959 0.1416047 0.3348927 1.0000000
#> 6 6 -1.1020408 0.0767685 0.3515473 0.5421325
#>   x   s         p        p2         r
#> 1 1 0.6 0.1480744 0.4501660 1.0000000
#> 2 2 0.8 0.1808585 0.3289329 1.2214028
#> 3 3 1.0 0.2209011 0.3791525 1.4918247
#> 4 4 0.8 0.1808585 0.3289329 1.2214028
#> 5 5 0.6 0.1480744 0.3289329 1.0000000
#> 6 6 0.4 0.1212331 0.4501660 0.8187308
#>   x   s         p        p2         r
#> 1 1 1.0 0.2135147 0.5249792 1.0000000
#> 2 2 0.9 0.1931961 0.3322250 0.9048374
#> 3 3 0.8 0.1748111 0.3322250 0.8187308
#> 4 4 0.7 0.1581756 0.3322250 0.7408182
#> 5 5 0.6 0.1431232 0.3420088 0.6703200
#> 6 6 0.4 0.1171794 0.4501660 0.5488116
#>   x   s         p        p2        r
#> 1 1 0.6 0.1305469 0.4750208 1.000000
#> 2 2 0.7 0.1442766 0.3322250 1.105171
#> 3 3 0.8 0.1594504 0.3322250 1.221403
#> 4 4 0.9 0.1762199 0.3322250 1.349859
#> 5 5 1.0 0.1947531 0.3442533 1.491825
#> 6 6 1.0 0.1947531 0.5000000 1.491825
#>   x   s         p        p2        r
#> 1 1 2.8 0.1043514 0.4501660 1.000000
#> 2 2 3.0 0.1274551 0.3289329 1.221403
#> 3 3 3.2 0.1556740 0.3289329 1.491825
#> 4 4 3.4 0.1901406 0.3289329 1.822119
#> 5 5 3.6 0.2322383 0.3791525 2.225541
#> 6 6 3.4 0.1901406 0.4501660 1.822119
#>   x    s          p        p2         r
#> 1 1  0.4 0.25939861 0.5498340 1.0000000
#> 2 2  0.2 0.21237762 0.3289329 0.8187308
#> 3 3  0.0 0.17388009 0.3289329 0.6703200
#> 4 4 -0.2 0.14236097 0.3289329 0.5488116
#> 5 5 -0.4 0.11655531 0.3289329 0.4493290
#> 6 6 -0.6 0.09542741 0.4501660 0.3678794
#>   x    s          p        p2        r
#> 1 1 -0.4 0.09542741 0.4501660 1.000000
#> 2 2 -0.2 0.11655531 0.3289329 1.221403
#> 3 3  0.0 0.14236097 0.3289329 1.491825
#> 4 4  0.2 0.17388009 0.3289329 1.822119
#> 5 5  0.4 0.21237762 0.3289329 2.225541
#> 6 6  0.6 0.25939861 0.5498340 2.718282
#>   x         s           p        p2          r
#> 1 1 -2.114286 0.003309969 0.2578558   1.000000
#> 2 2 -1.057143 0.009526540 0.2366537   2.878136
#> 3 3  0.000000 0.027418678 0.2366537   8.283667
#> 4 4  1.057143 0.078914683 0.2366537  23.841519
#> 5 5  2.114286 0.227127190 0.2366537  68.619135
#> 6 6  3.171429 0.653702940 0.7421442 197.495201
#>   x          s           p        p2         r
#> 1 1 -1.7142857 0.007969358 0.2979366  1.000000
#> 2 2 -0.8571429 0.018779143 0.2644949  2.356418
#> 3 3  0.0000000 0.044251518 0.2644949  5.552708
#> 4 4  0.8571429 0.104275094 0.2644949 13.084503
#> 5 5  1.7142857 0.245715754 0.2644949 30.832565
#> 6 6  2.5714286 0.579009134 0.7020634 72.654424
alters1 <- rep(c(1, 2, 2), 100)
finluenceplot(alters = alters1, min = 1, max = 6, list(favSim), params = c(1))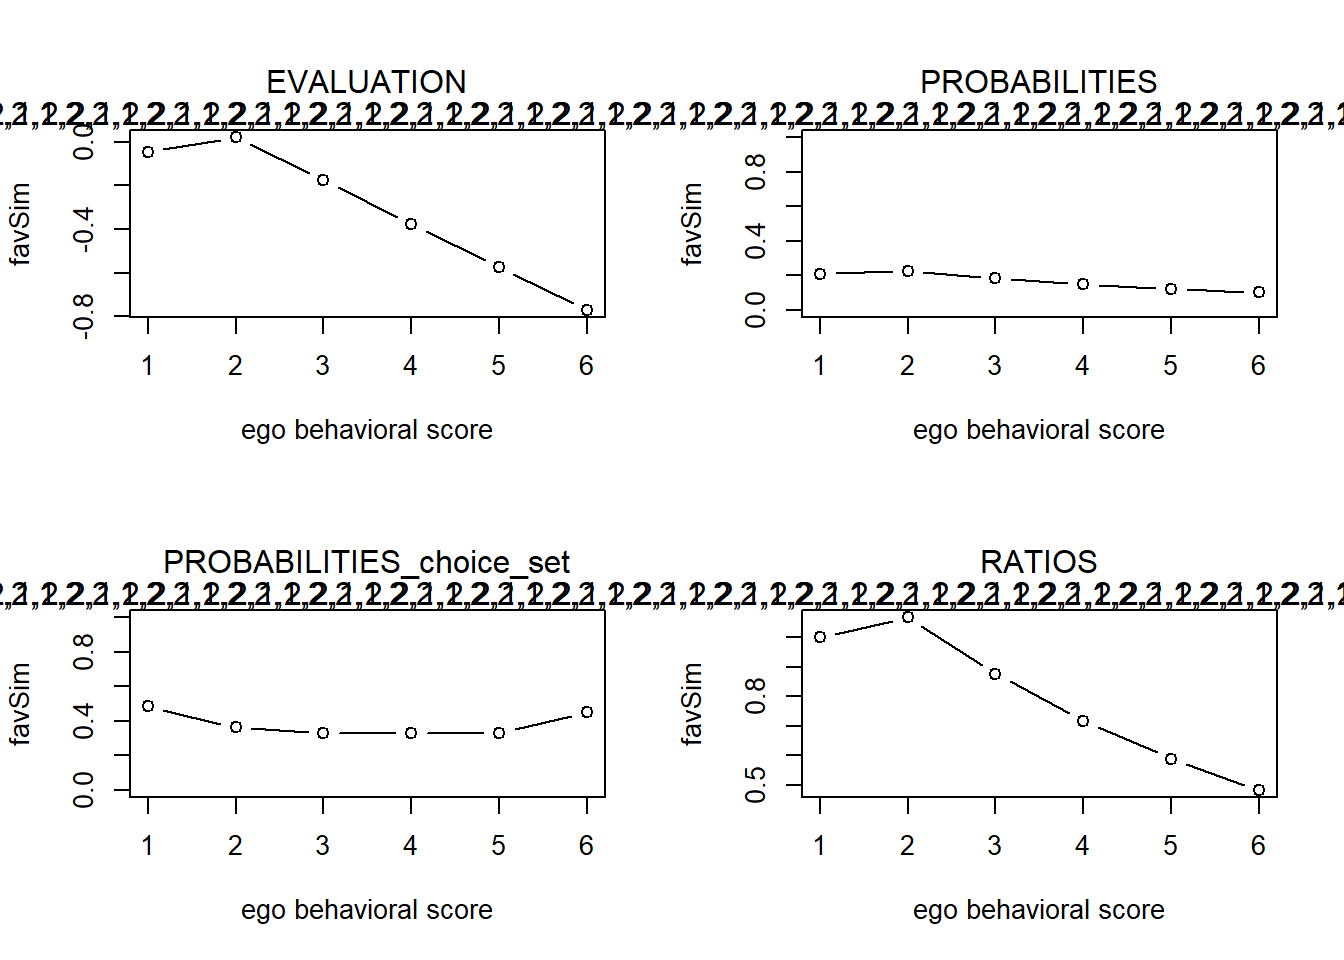
finluenceplot(alters = alters1, min = 1, max = 6, list(favAlt), params = c(1))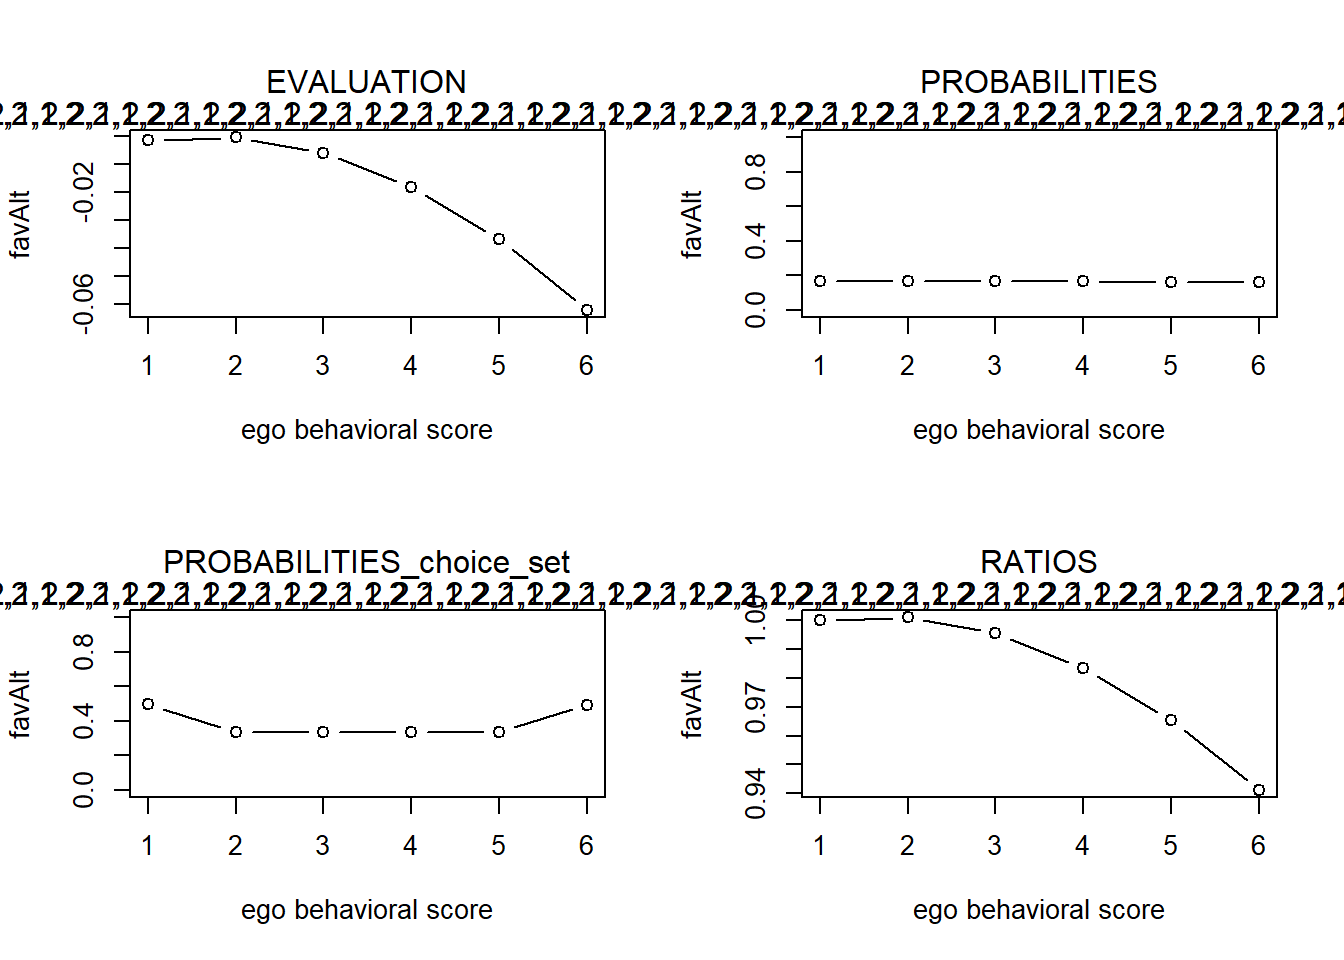
finluenceplot(alters = alters1, min = 1, max = 6, list(fAttMean), params = c(1))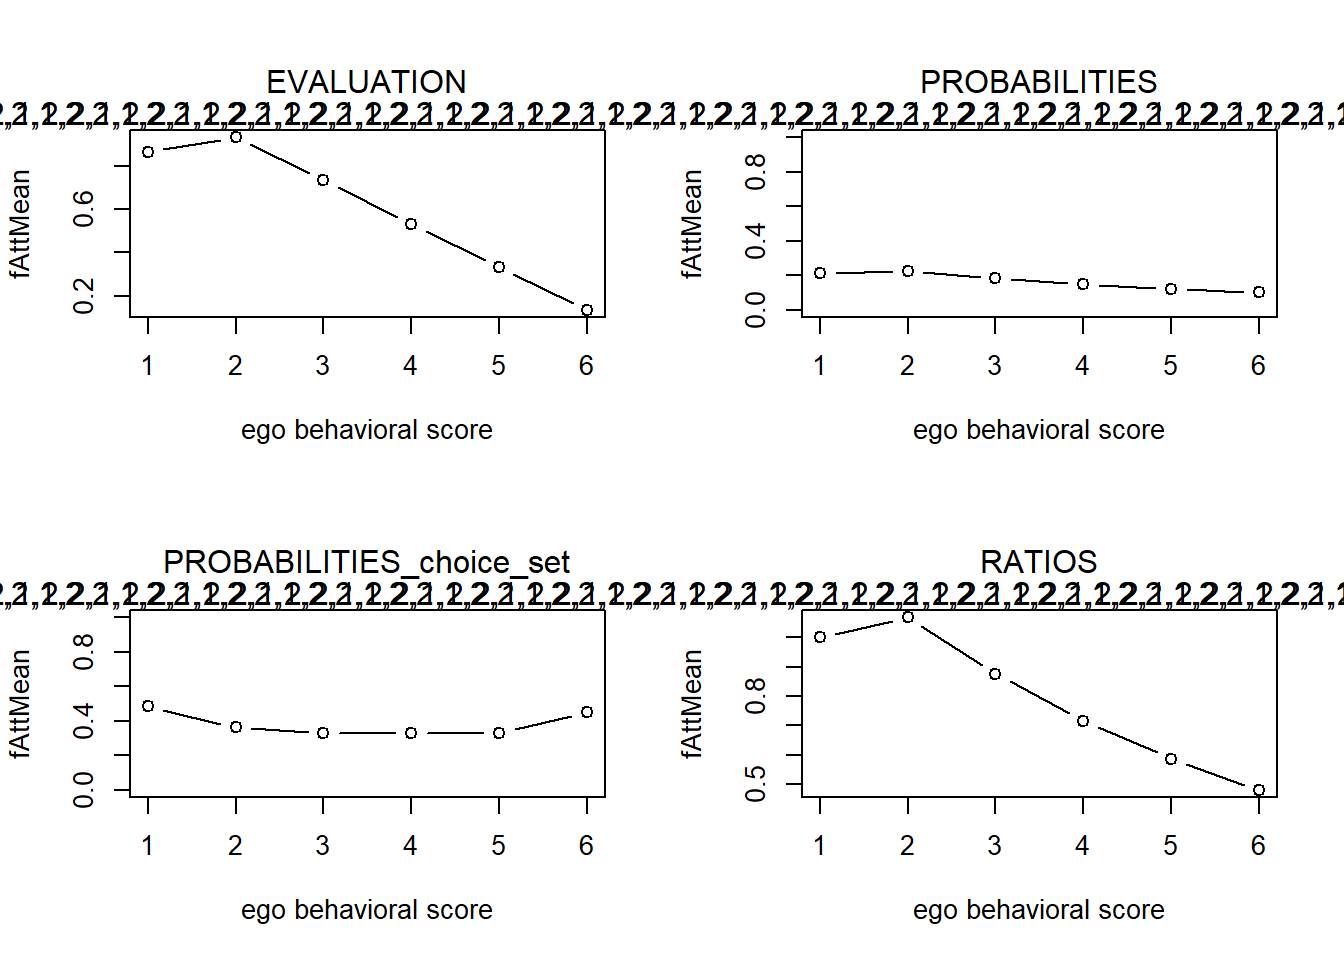
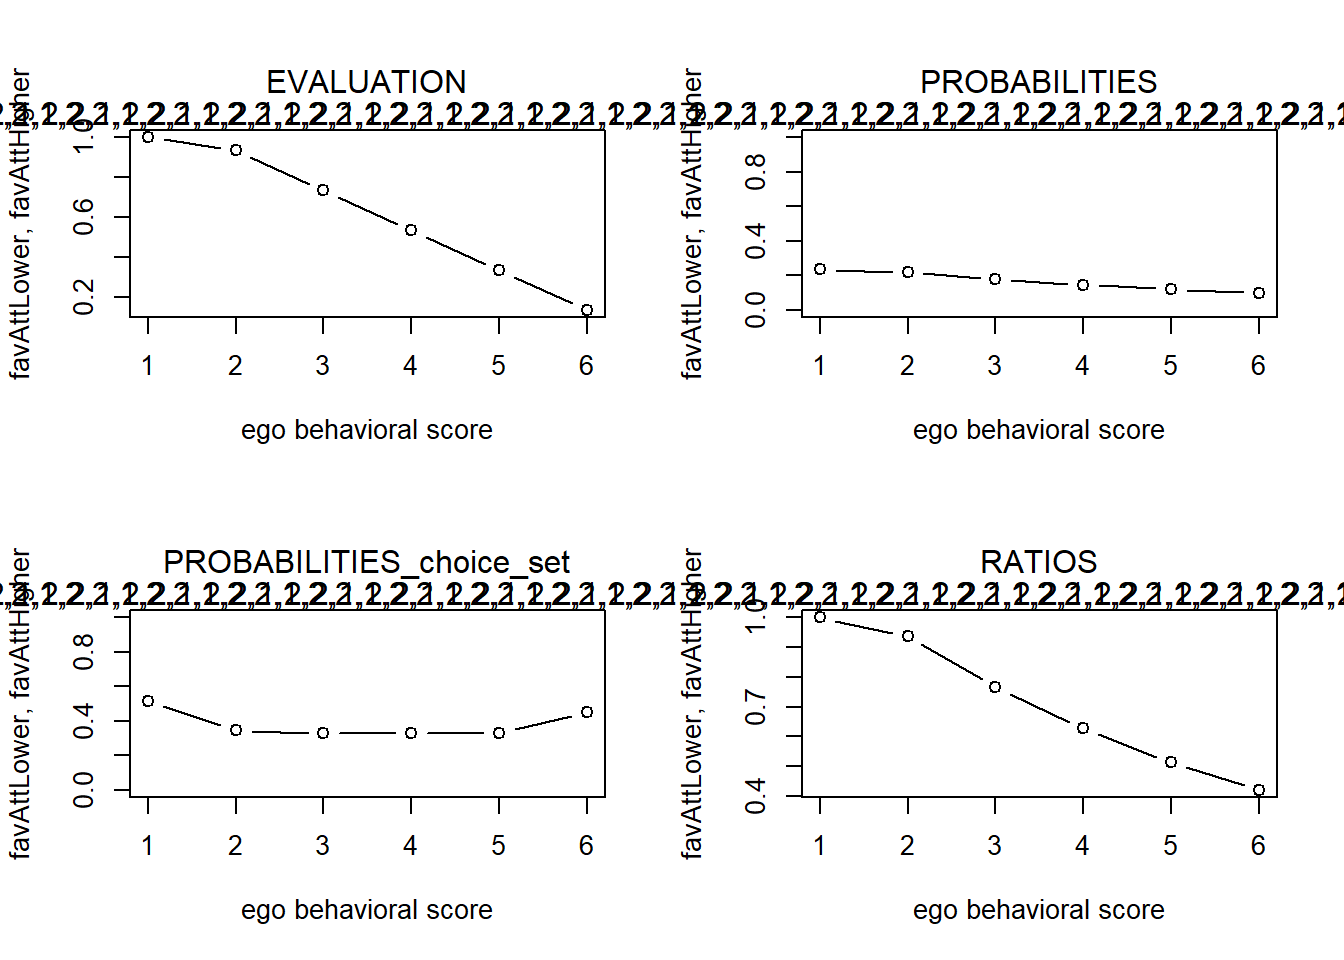
finluenceplot(alters = alters1, min = 1, max = 6, fun = list(favAttLower, favAttHigher), params = c(1,
    0))
finluenceplot(alters = alters1, min = 1, max = 6, fun = list(favAttLower, favAttHigher), params = c(0,
    1))
finluenceplot(alters = alters1, min = 1, max = 6, fun = list(favAttLower, favAttHigher), params = c(1,
    1))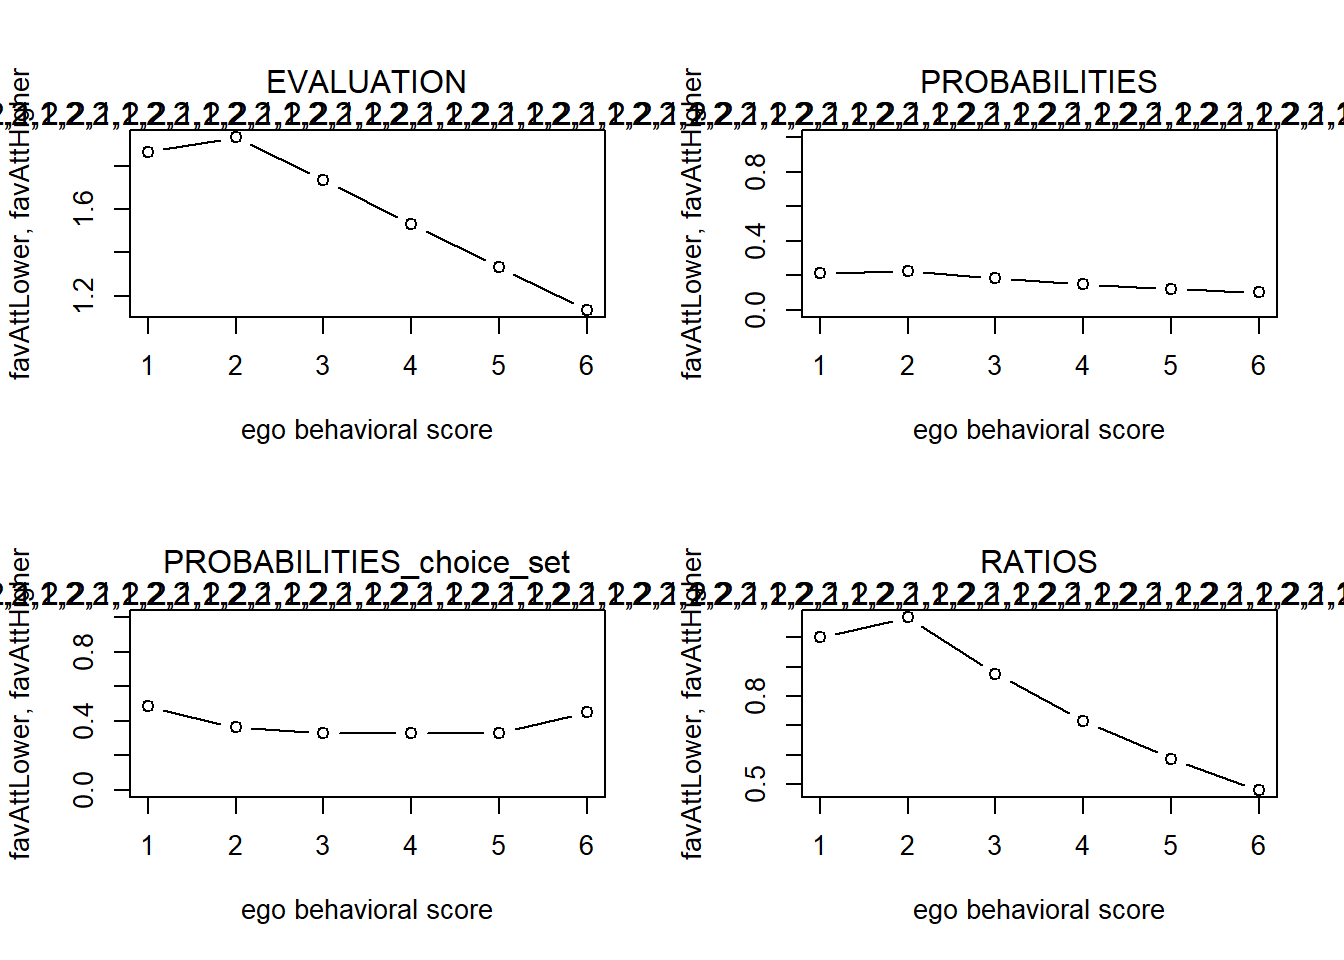
finluenceplot(alters = alters1, min = 1, max = 6, fun = list(favAttLower, favAttHigher), params = c(1,
    -1))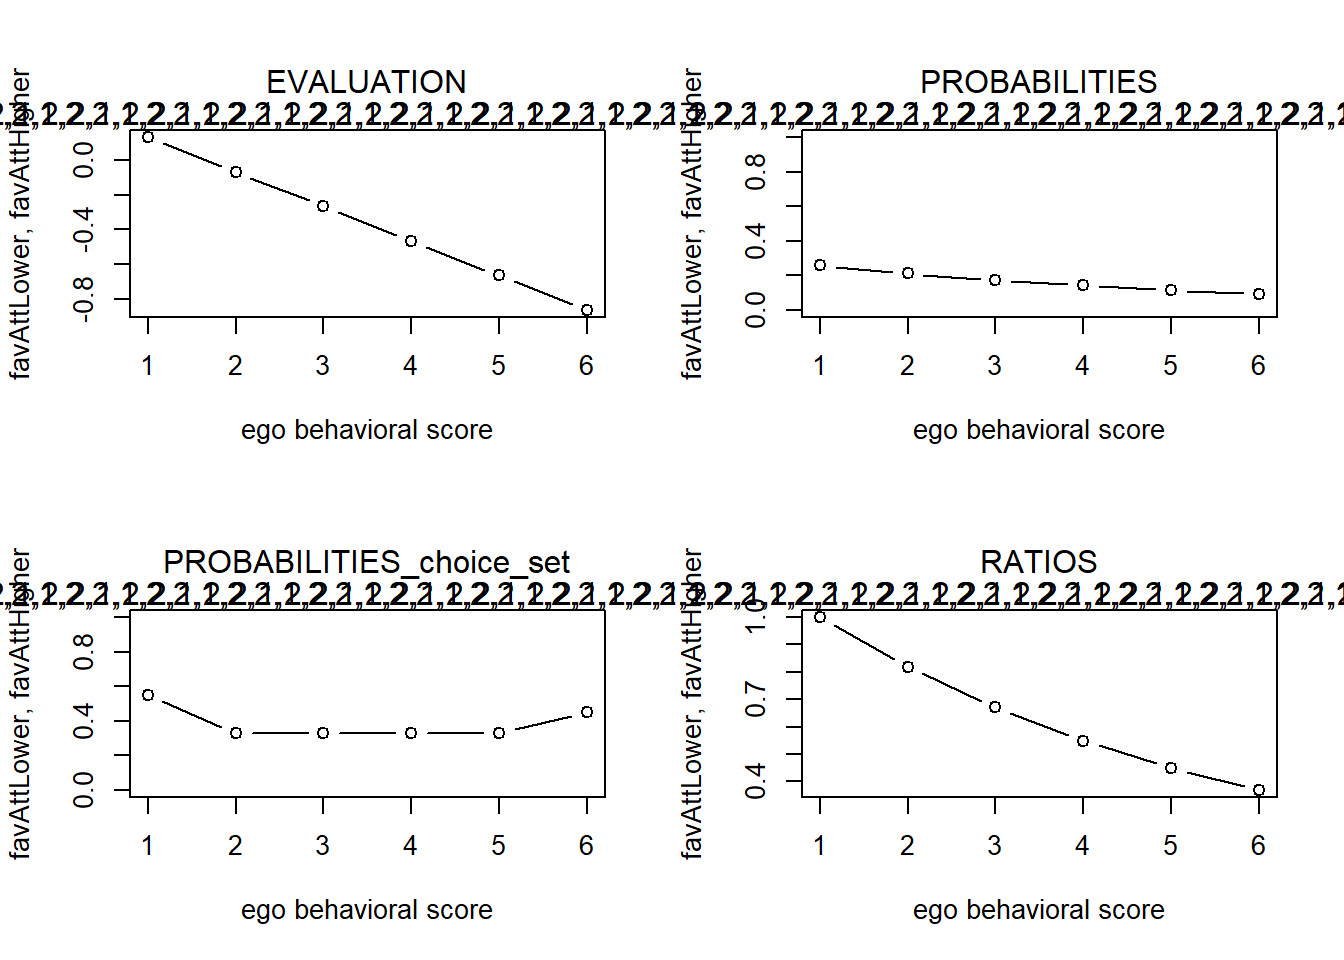
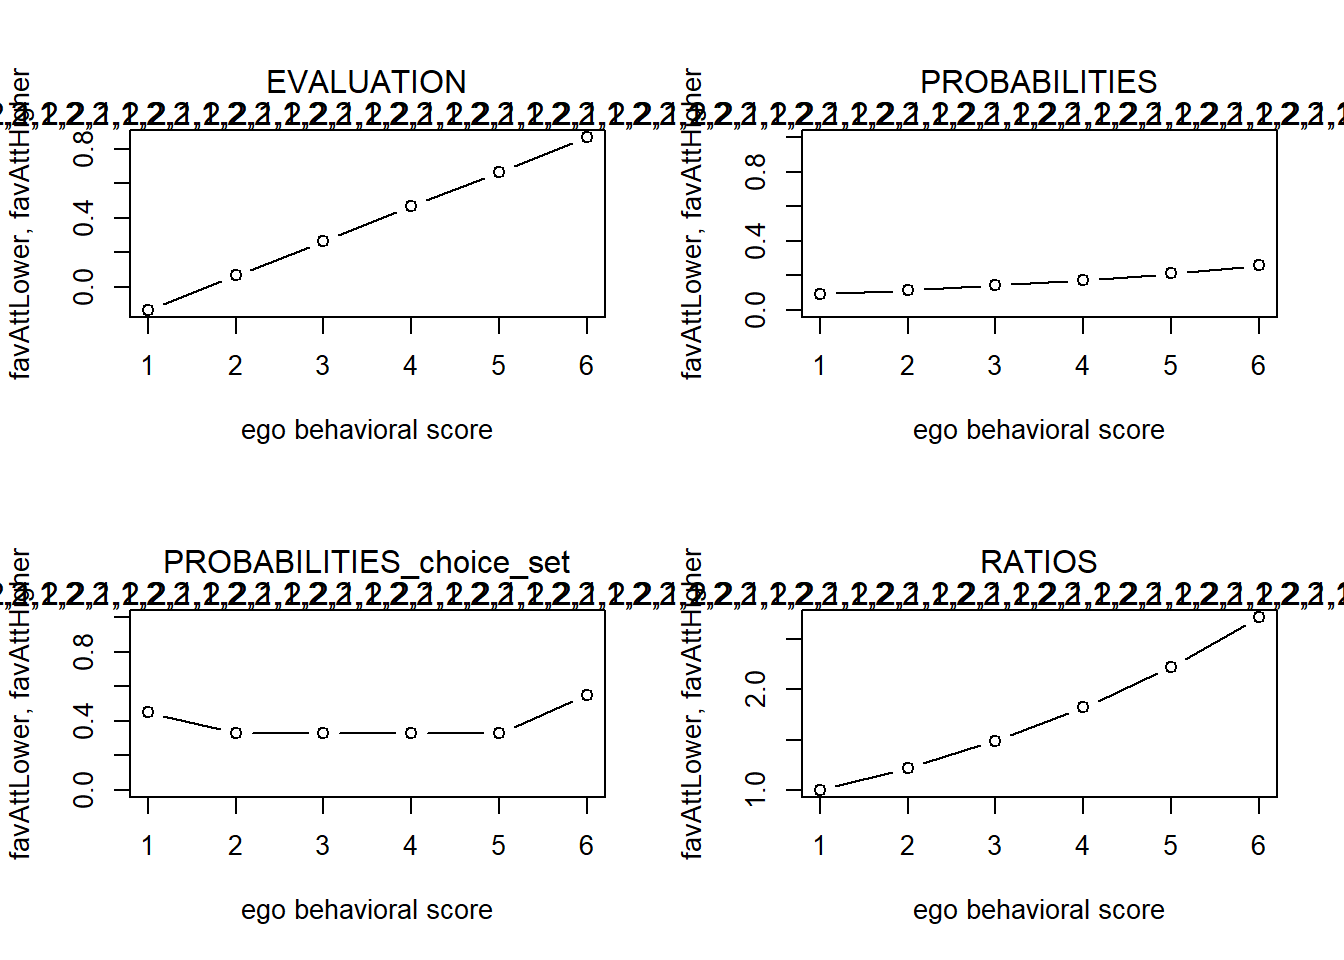
finluenceplot(alters = alters1, min = 1, max = 6, fun = list(favAttLower, favAttHigher), params = c(-1,
    1))
#>   x           s         p        p2         r
#> 1 1 -0.04385382 0.2112416 0.4834501 1.0000000
#> 2 2  0.02236988 0.2257045 0.3628788 1.0684657
#> 3 3 -0.17630122 0.1850369 0.3289906 0.8759490
#> 4 4 -0.37497231 0.1516969 0.3289906 0.7181201
#> 5 5 -0.57364341 0.1243640 0.3289906 0.5887288
#> 6 6 -0.77231451 0.1019561 0.4504950 0.4826514
#>   x             s         p        p2         r
#> 1 1 -0.0014716541 0.1698751 0.4997241 1.0000000
#> 2 2 -0.0003679135 0.1700628 0.3340690 1.0011043
#> 3 3 -0.0058866164 0.1691268 0.3340609 0.9955948
#> 4 4 -0.0180277628 0.1670858 0.3340430 0.9835802
#> 5 5 -0.0367913526 0.1639799 0.3340154 0.9652968
#> 6 6 -0.0621773858 0.1598695 0.4936538 0.9411001
#>   x         s         p        p2         r
#> 1 1 0.8666667 0.2115240 0.4833395 1.0000000
#> 2 2 0.9333333 0.2261063 0.3630769 1.0689391
#> 3 3 0.7333333 0.1851202 0.3289329 0.8751733
#> 4 4 0.5333333 0.1515636 0.3289329 0.7165313
#> 5 5 0.3333333 0.1240898 0.3289329 0.5866462
#> 6 6 0.1333333 0.1015961 0.4501660 0.4803053
#>   x         s          p        p2         r
#> 1 1 1.0000000 0.23461556 0.5166605 1.0000000
#> 2 2 0.9333333 0.21948449 0.3463000 0.9355070
#> 3 3 0.7333333 0.17969871 0.3289329 0.7659283
#> 4 4 0.5333333 0.14712486 0.3289329 0.6270891
#> 5 5 0.3333333 0.12045564 0.3289329 0.5134171
#> 6 6 0.1333333 0.09862074 0.4501660 0.4203504
#>   x         s         p        p2        r
#> 1 1 0.8666667 0.1489613 0.4667160 1.000000
#> 2 2 1.0000000 0.1702077 0.3478051 1.142631
#> 3 3 1.0000000 0.1702077 0.3333333 1.142631
#> 4 4 1.0000000 0.1702077 0.3333333 1.142631
#> 5 5 1.0000000 0.1702077 0.3333333 1.142631
#> 6 6 1.0000000 0.1702077 0.5000000 1.142631
#>   x        s         p        p2         r
#> 1 1 1.866667 0.2115240 0.4833395 1.0000000
#> 2 2 1.933333 0.2261063 0.3630769 1.0689391
#> 3 3 1.733333 0.1851202 0.3289329 0.8751733
#> 4 4 1.533333 0.1515636 0.3289329 0.7165313
#> 5 5 1.333333 0.1240898 0.3289329 0.5866462
#> 6 6 1.133333 0.1015961 0.4501660 0.4803053
#>   x           s          p        p2         r
#> 1 1  0.13333333 0.25939861 0.5498340 1.0000000
#> 2 2 -0.06666667 0.21237762 0.3289329 0.8187308
#> 3 3 -0.26666667 0.17388009 0.3289329 0.6703200
#> 4 4 -0.46666667 0.14236097 0.3289329 0.5488116
#> 5 5 -0.66666667 0.11655531 0.3289329 0.4493290
#> 6 6 -0.86666667 0.09542741 0.4501660 0.3678794
#>   x           s          p        p2        r
#> 1 1 -0.13333333 0.09542741 0.4501660 1.000000
#> 2 2  0.06666667 0.11655531 0.3289329 1.221403
#> 3 3  0.26666667 0.14236097 0.3289329 1.491825
#> 4 4  0.46666667 0.17388009 0.3289329 1.822119
#> 5 5  0.66666667 0.21237762 0.3289329 2.225541
#> 6 6  0.86666667 0.25939861 0.5498340 2.718282
Results model strava
alters1 <- rep(c(2, 2, 2, 5, 5, 5))
alters2 <- rep(c(3.5, 3.5, 3.5, 3.5, 3.5, 3.5))
# club1
finluenceplot(alters = alters1, min = 1, max = 6, results = FALSE, fun = list(flinear, fquad, favAttHigher,
favAttLower), params = c(-0.15, -0.002, 2.0027, 6.0905))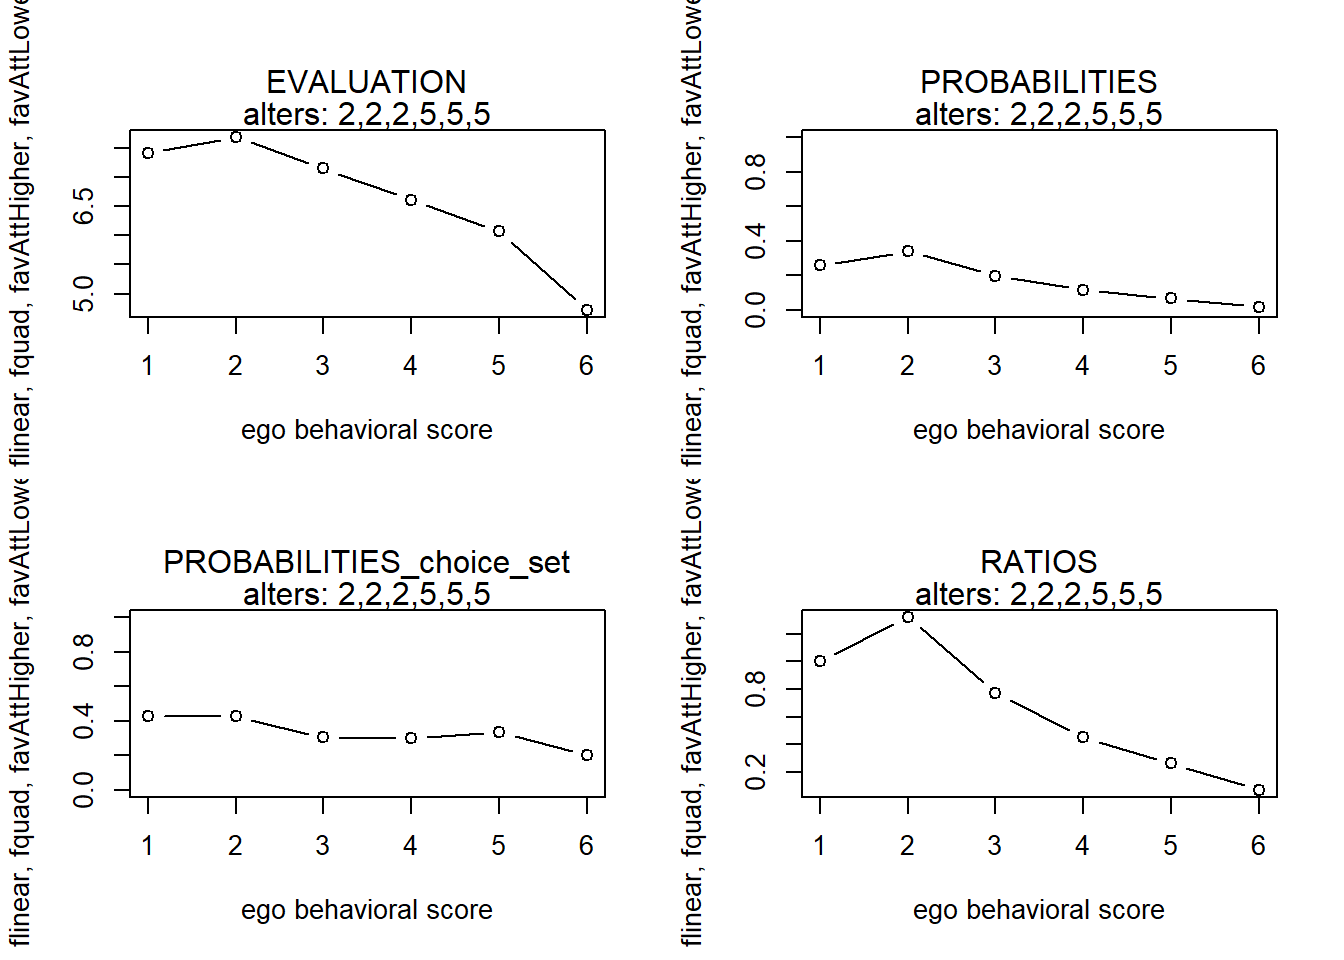
finluenceplot(alters = alters2, min = 1, max = 6, results = FALSE, fun = list(flinear, fquad, favAttHigher,
    favAttLower), params = c(-0.15, -0.002, 2.0027, 6.0905))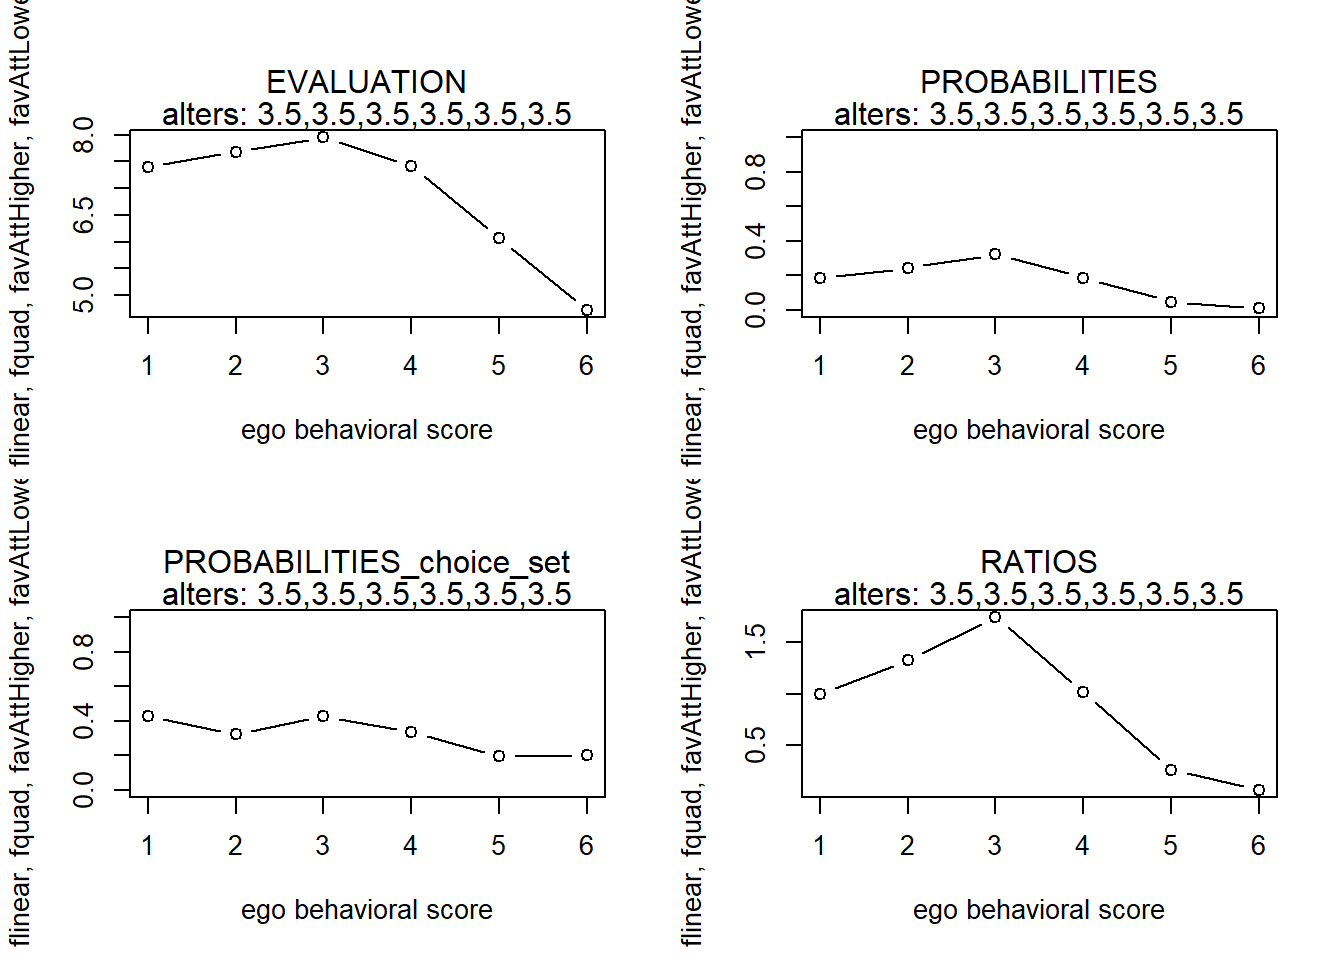
# club2
finluenceplot(alters = alters1, min = 1, max = 6, results = FALSE, fun = list(flinear, fquad, favAttHigher,
    favAttLower), params = c(-0.24, 0.0075, 3.3213, 5.0047))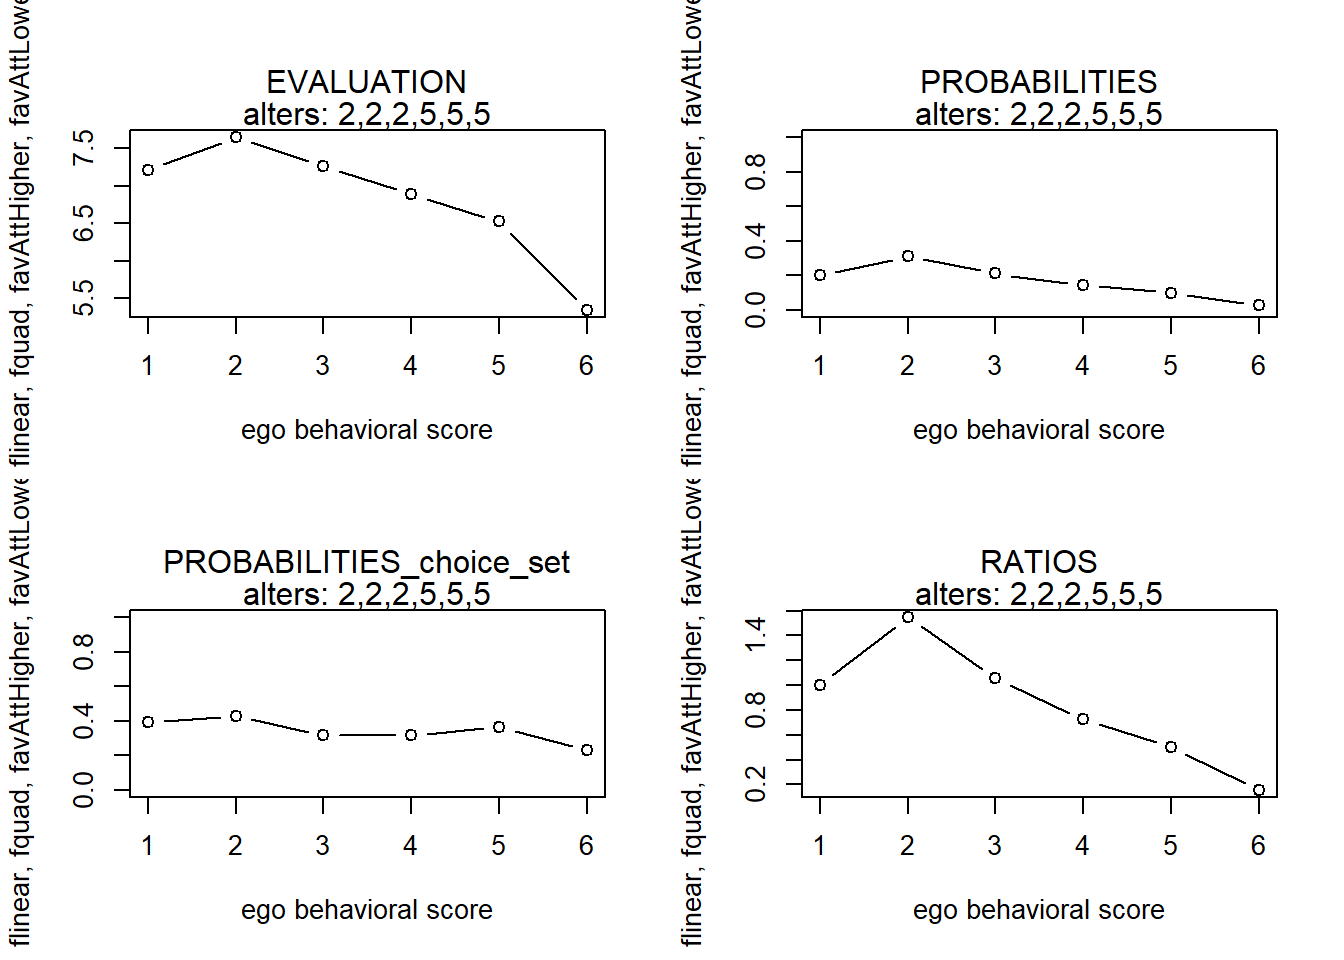
finluenceplot(alters = alters2, min = 1, max = 6, results = FALSE, fun = list(flinear, fquad, favAttHigher,
    favAttLower), params = c(-0.24, 0.0075, 3.3213, 5.0047))
# club3
finluenceplot(alters = alters1, min = 1, max = 6, results = FALSE, fun = list(flinear, fquad, favAttHigher,
    favAttLower), params = c(-0.2085, 0.021, 3.7703, 2.1283))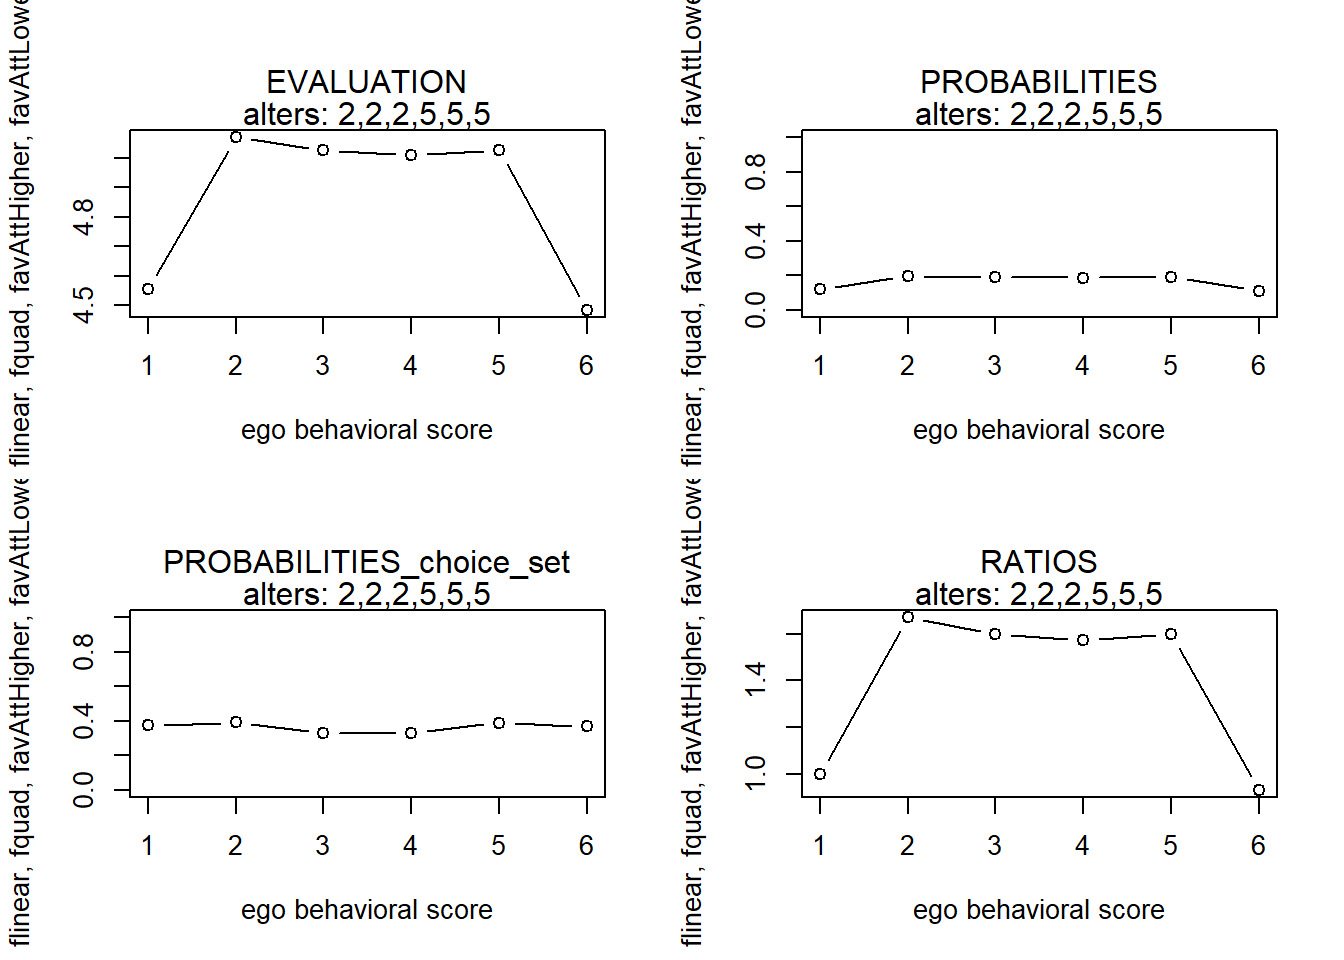
finluenceplot(alters = alters2, min = 1, max = 6, results = FALSE, fun = list(flinear, fquad, favAttHigher,
    favAttLower), params = c(-0.2085, 0.021, 3.7703, 2.1283))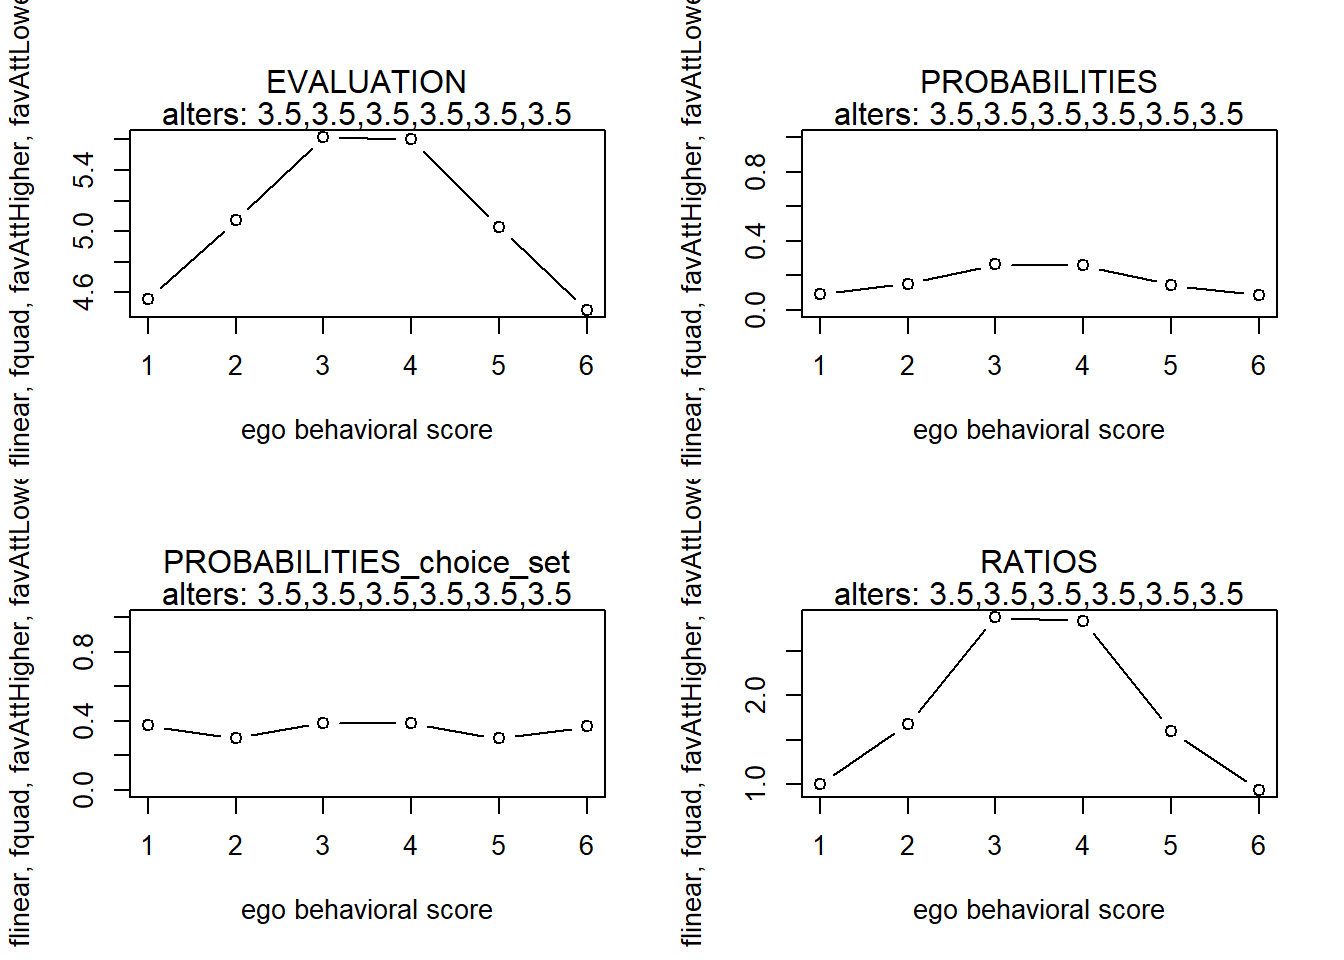
# club4
finluenceplot(alters = alters1, min = 1, max = 6, results = FALSE, fun = list(flinear, fquad, favAttHigher,
    favAttLower), params = c(-1.3313, 0.0192, 2.5493, 4.4952))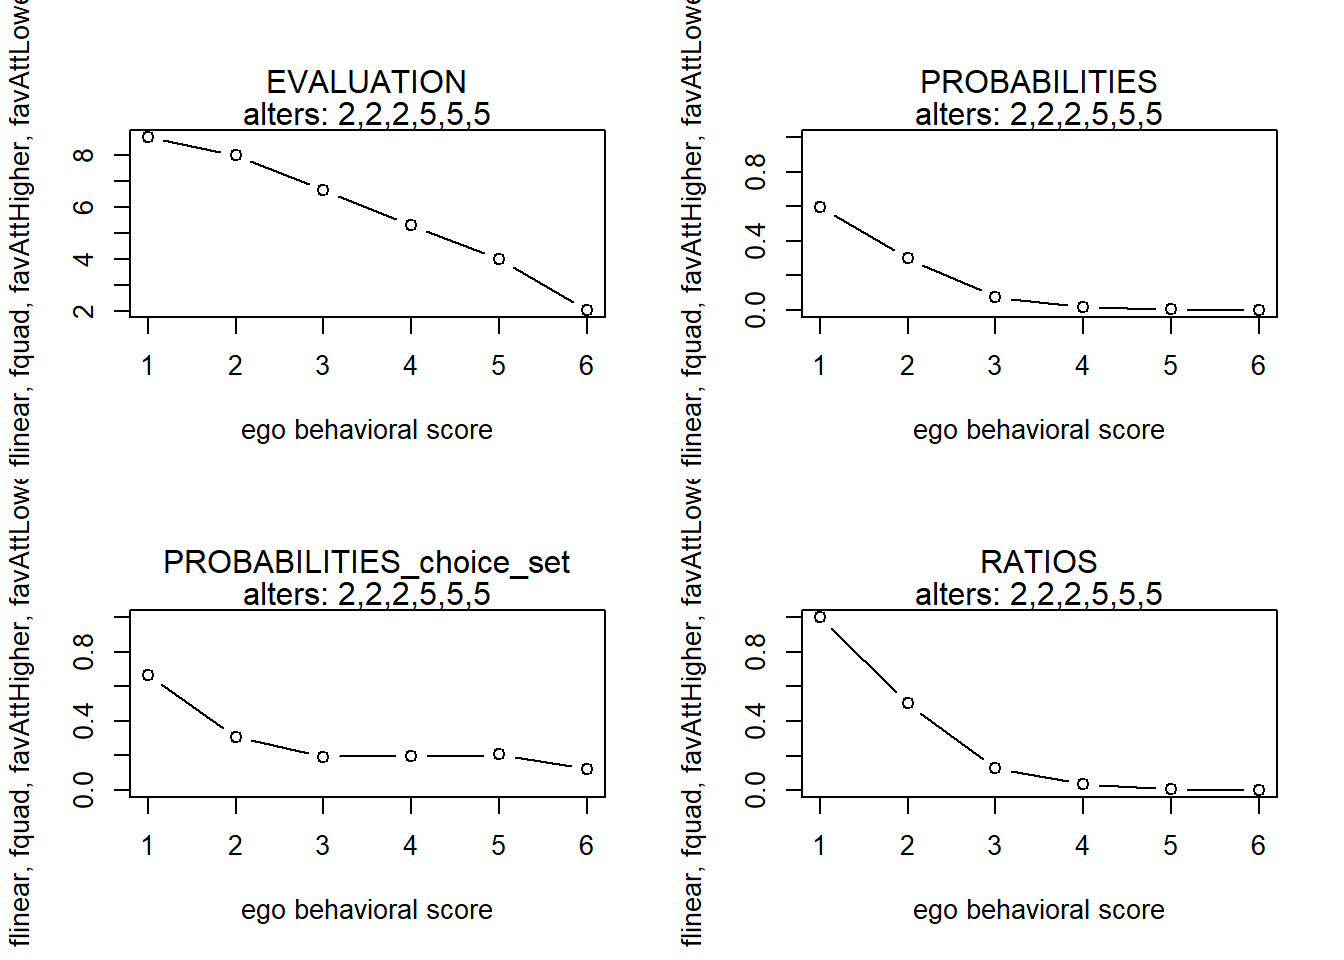
finluenceplot(alters = alters2, min = 1, max = 6, results = FALSE, fun = list(flinear, fquad, favAttHigher,
    favAttLower), params = c(-1.3313, 0.0192, 2.5493, 4.4952))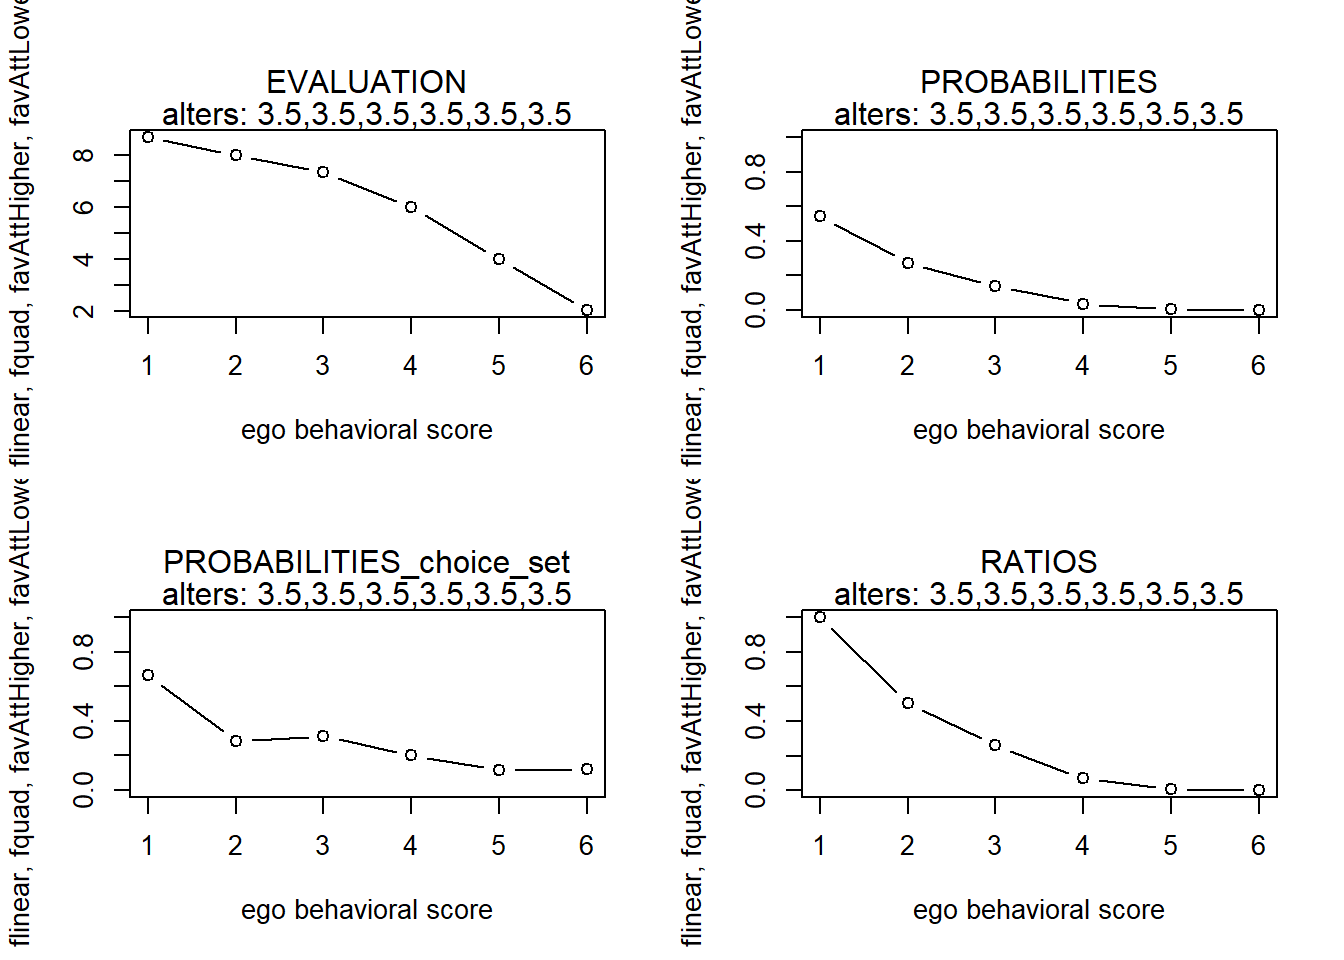
# club5
finluenceplot(alters = alters1, min = 1, max = 6, results = FALSE, fun = list(flinear, fquad, favAttHigher,
    favAttLower), params = c(0.1021, 0.0743, 1.1736, 8.5486))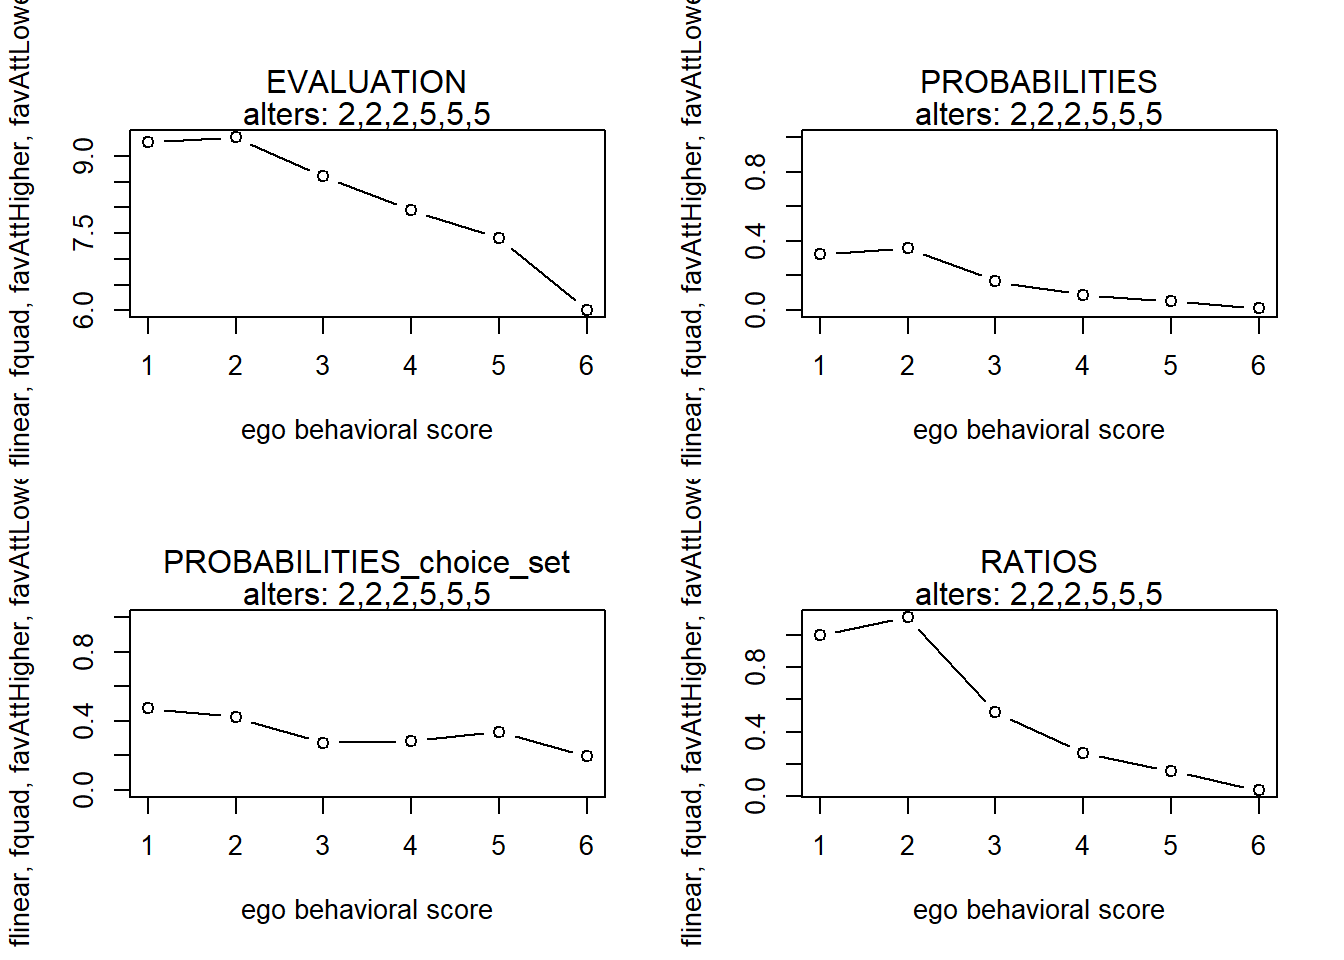
finluenceplot(alters = alters2, min = 1, max = 6, results = FALSE, fun = list(flinear, fquad, favAttHigher,
    favAttLower), params = c(0.1021, 0.0743, 1.1736, 8.5486))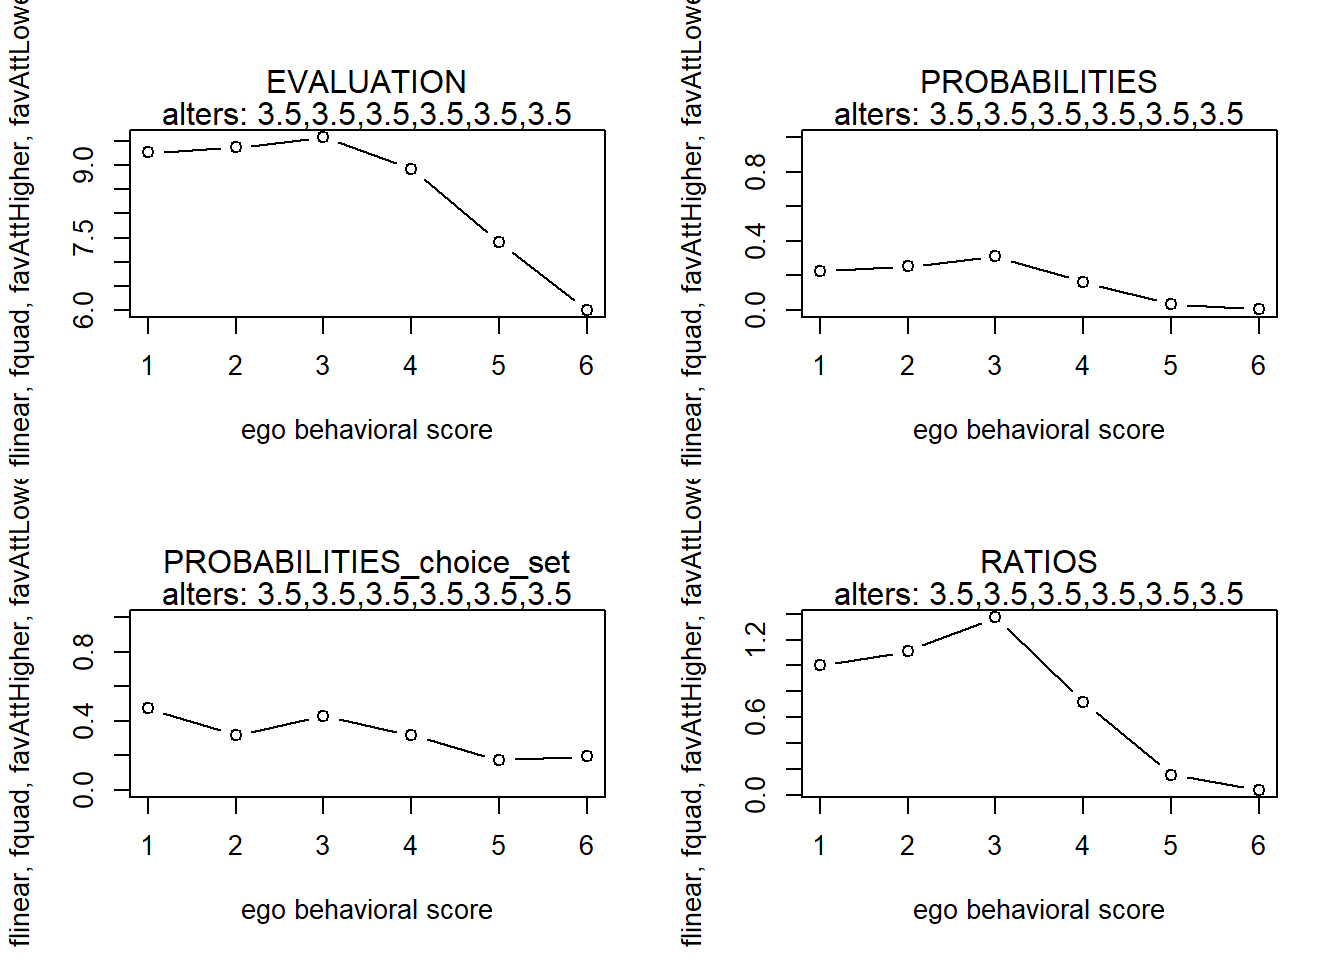
Copyright © 2021 Rob Franken